 |
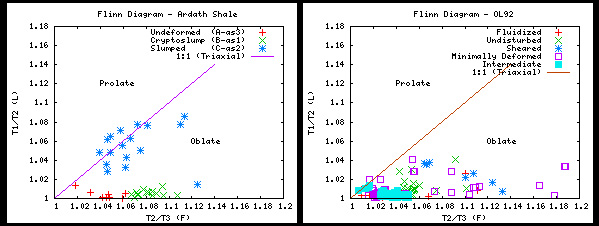
The Flinn diagram and the very related Jelinek diagram show the
traditional method for displaying Anisotropy of Magnetic
Susceptibility data. The left image shows the Ardath Slump with
undeformed sediments showing in red. To the right are green
crypto-slump sediments, while the slump in blue lies along the 1:1
line. Maybe this could be an okay fabric classifier.
Looking at the right diagram of the Owen's Lake OL92 core, which shows
that the Flinn diagram breaks down completely in other cases. Each of
the groups of samples lay all over each other.
We clearly need more ways to look at AMS fabric data. Here we have
used a plot of just the ratios of the three eigen values. We are
using a 2D plot for data that has 6 degrees of freedom.
|
  |
|
|
|