Chapter XXX: Python - utility knife that will last a lifetime - introduction
$Id: kurt-2010.org 13030 2010-01-14 13:33:15Z schwehr $
Table of Contents
Introduction
Why learn about python?
Python is a great combination langage that fills the gap between shell scripting and heavy duty low level programming for speed. It is able to handle simple jobs easily, but can grow to enormous projects without missing a step. It includes graphical user interfaces, networking/web frameworks, scientific data processing, geographic information systems, databases, and tools to untangle annoying binary formats in a style that is good for both the common computer user and the computer scientist. The language supports the programmer by providing access to C and C++ libraries, interpreted shells (ipython), documentation and unit testing, and introspection (python can look at itself).
There are thousands of add on packages (currently more than 12,000) to help get you along the way to accomplishing your goals that led you to use python. There is an archive where people can register their contributions called PyPI.
Python can do just about everything that Bash, C/C++, and Matlab can while being easier to use and, unlike Matlab, you don't have to buy it.
Additionally, python is built into QGIS, ArcGIS, and many other tools. If you learn python, you will be better able to use these.
Why not to use python?
Remember that every tool (hopefully) has its sweets spot(s). That also means that there really is not one best programming language in the world. Additionally, some people may find that Python's style is not a good fit for them. The mandatory indenting of text in python often is uncomfortable for many long time C or Perl programmers. I personally was really frustrated with that particular feature for about 2 weeks back in the mid 1990's, but have loved it ever since.
Installing python
Hopefully you already have the basics of python and the IPython interpreter installed. We are going to start with those and avoid having to start off installing extra packages. IPython is just like python, but adds features that are more typical of working with the bash shell (covered in chapter XXX).
This chapter assumes that you have installed Python 2.7 from python.org and IPython 0.10 from ipython.scipy.org in addition to Google Earth.
Windows
If you are on Windows, you will might want to use the Scintilla SciTE text editor that will color your code. However, I usually use emacs for all my code and documents. Windows users will need to install pyreadline in addition to python and ipython:
Mac
On the Mac, you should probably install Fink, which gives you many of the programs available on Linux. I also find the Smultron text editor a nice tool to have for editing text if you are not comfortable with Emacs. XCode is powerful, but it is pretty limited in its flexibility.
Linux
Just make sure you are using a recent Linux distribution. CentOS, RedHat, or Debian will be so out of date that you will pull out your hair. I prefer Ubuntu to FedoraCore, but both of these two are pretty good about being current.
Python3 / Python3000
There is a newer version of python around. Anything a version number of 3 or greater will act somewhat differently than python 2.7. Do not worry that what you are learning might not be useful with python 3. Most of the hard work of switching went to the people who work in C behind the scenes to build python and the core modules. There is a program that will convert your code to python 3 for you. At the time I am writing the first version on this chapter (2010), not enough of the extra addon libraries have been converted to python 3.
Goals for this chapter
In this chapter, I will try to acquaint you with the very basics of working with python. We will try to actually get some work done parsing data files and turn them into Google Earth visualizations. In later chapters, we will attack the fancier features of python that help you to reuse your code and/or write larger programs without being overwhelmed.
Alternative introductions and guides to python
Free
Books and web pages available to free. I suggest you find a way to support the author(s) if you find a particular book or web page to be the best one for you. If they offer a book (especially if it is an environmentally friendly ebook), buy a copy.
Books:
- Dive Into Python by Mark Pilgrim, 2004
- Think Python: How to Think Like a Computer Scientist by Allen Downey, 2008
Classes:
- Geoprocessing with Python using Open Source GIS by Chris Garrard, 2009.
- Lectures for Intro to Computing at SIO by Lisa Tauxe, 2010. (Lisa Co-chaired my PhD)
- Python Short Course by Richard Muller, 2000. Getting a bit old.
Web tutorials and references:
- Python.org Documentation - The definitive source for documentation
- iPython Documentation - For all the details of iPython
- Python Module of the Week (PyMOTW) by Doug Hellmann
- Google Python Style Guide
- Code Like a Pythonista: Idiomatic Python by David Goodger, 2008
iTunesU, YouTube, and other videos:
- Introductionto Computer Science and Programming by Eric Grimson and John Guttag, 2009. (MIT)
- ShowMeDo Python
For pay only
I have not necessarily read any of these!
- Scientific Scripting with Python by Drew McCormack, 2009. This book is through Lulu, so the author is self publishing. Support a great concept, where the author gets most of the proceeds.
- Python Scripting for Computational Science by Hans Petter Langtangen, 2008.
Trying out python
Time to fire up python and get started! The first time you run it, it will setup your IPython environment. Don't worry about what it is doing right now, but don't be surprised when the startup prints less text the next time you run ipython.
Running ipython
Windows
On windows, Start -> All Programs -> IPython -> IPython.
Mac and Linux
Open a terminal and type "ipython"
Moving about in ipython
IPython tries to be like a bash shell that I covered in a previous chapter. It provides ways to move around the directories (often called Folders) and manipulate files.
ipython
Python 2.7 (r27:82500, Oct 22 2010, 09:13:09)
Type "copyright", "credits" or "license" for more information.

IPython 0.10 -- An enhanced Interactive Python.
?         -> Introduction and overview of IPython's features.
%quickref -> Quick reference.
help      -> Python's own help system.
object?   -> Details about 'object'. ?object also works, ?? prints more.

In [1]: pwd
Out[1]: '/Users/schwehr/'

In [2]: ls
Access/     Library/   Public/   objects/
Desktop/    Movies/    Sites/    org-7.3/
Documents/  Music/     bin/      projects/
Downloads/  Pictures/  example/
A little math
IPython keeps around the value of the most recent result from any math or function calls. Let's try some simple math. Comments follow the "#" character (often called pound, hash, or number sign).
# Addition with the +
In [1]: 2+5
Out[1]: 7

# The "_" is the result of the last operation or the number "7"
In [2]: _ * 10
Out[2]: 70

# Two "*" characters switches the multiplication to power.  This is 2
# to the 8th power
In [3]: 2**8
Out[3]: 256

# The percent is the remainder operation, which is often called "mod"
# It only works for integer numbers
In [4]: 2001 % 1000
Out[4]: 1

# Dividing an integer by an integer results in an integer
In [5]: 2001 / 1000
Out[5]: 2

# If either number is a floating point number, the result is a
# floating point
In [6]: 2001 / 1000.
Out[6]: 2.001
More powerful math is hidden inside of a "module". Modules wrap like functionality together. You have to tell python to load a module so that you can use it. This is accomplished with the "import" command.
The contents of modules is accessed with the period ("."). Once you have loaded a module, you can press the tab key after the module name followed by a period to list the contents of a module.
Windows users, you will find that the tab key does not work for you. The Microsoft design does not support the library that allows this feature to work on Mac and Linux computers. You can get these features through the Unix add-on called Cygwin, but that does not always work well.
In [1]: import math

In [2]: math.
math.__class__         math.asin              math.gamma
math.__delattr__       math.asinh             math.hypot
math.__dict__          math.atan              math.isinf
math.__doc__           math.atan2             math.isnan
math.__file__          math.atanh             math.ldexp
math.__format__        math.ceil              math.lgamma
math.__getattribute__  math.copysign          math.log
math.__hash__          math.cos               math.log10
math.__init__          math.cosh              math.log1p
math.__name__          math.degrees           math.modf
math.__new__           math.e                 math.pi
math.__package__       math.erf               math.pow
math.__reduce__        math.erfc              math.radians
math.__reduce_ex__     math.exp               math.sin
math.__repr__          math.expm1             math.sinh
math.__setattr__       math.fabs              math.sqrt
math.__sizeof__        math.factorial         math.tan
math.__str__           math.floor             math.tanh
math.__subclasshook__  math.fmod              math.trunc
math.acos              math.frexp
math.acosh             math.fsum

In [3]: math.pi
Out[3]: 3.141592653589793

In [4]: math.sin(math.pi)
Out[4]: 1.2246467991473532e-16
# The results here are as close to zero as floating point can get here
Strings are good too
Strings go between quotes. Strings are objects that we can do a lot of things to. We can ask a string to perform operations and do things that are similar to math. However, the meaning of the operators in math can have somewhat different behavior. Let's try a few things with strings to see how they work. Strings are really important for writing out the results of computations. Python can begin and end strings with matching single or double quotes ("). Here I will stick with the single
In [1]: 'hello world'
Out[1]: 'hello world'

In [2]: 'hello' + ' world'
Out[2]: 'hello world'

# How long is the string?
In [3]: len('hello world')
Out[3]: 11

In [4]: 'hello world'.capitalize()
Out[4]: 'Hello world'

In [5]: 'hello world'.upper()
Out[5]: 'HELLO WORLD'

In [6]: 'hello world'.split()
Out[6]: ['hello', 'world']

In [7]: "hello world".split()[0]
Out[7]: 'hello'
The last example above shows some of the power of strings in python that help us parse text that we get from the world. The "split" method asks the string to break into groups anywhere that there is white space (the space character or tabs). Python returns a list of strings denoted by the square brackets ("[ ]").
We can also tell split that we would like it to split on different characters. Here we ask it to break into groups separated by the period character:
In [8]: 'Hello world.  This is the end.'.split('.')
Out[8]: ['Hello world', '  This is the end', '']
We can combine strings, numbers and other objects in python with the "+" character, but we have to convert the other characters into strings. We can do that with the "str" function.
In [9]: 'Hello ' + str(42) + ' world'
Out[9]: 'Hello 42 world'
Variables and asking python about types
In [10]: a = 1

In [11]: b = 'two'

In [12]: c = math.pi

In [13]: type 1
-------> type(1)
Out[14]: <type 'int'>

In [15]: type b
-------> type(b)
Out[15]: <type 'str'>

In [16]: type c
-------> type(c)
Out[17]: <type 'float'>
A few more types
In [16]: import datetime

In [17]: datetime.datetime.now()
Out[17]: datetime.datetime(2010, 11, 22, 21, 34, 29, 582950)

In [18]: datetime.datetime.utcnow()
Out[18]: datetime.datetime(2010, 11, 23, 2, 34, 34, 572829)

In [19]: datetime.datetime.utcnow() - datetime.datetime.now()
Out[19]: datetime.timedelta(0, 17999, 999991)

In [20]: import time

In [21]: time.time()
Out[21]: 1290479721.297017
Python errors
In [15]: 1 + "two"
---------------------------------------------------------------------------
TypeError                                 Traceback (most recent call last)

/Users/schwehr/<ipython console> in <module>()

TypeError: unsupported operand type(s) for +: 'int' and 'str'
for loops
files
Working with actual data Part 1 - Lines
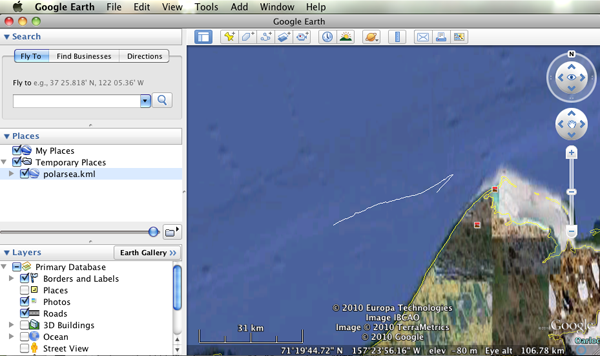
Download the data
Get the ship track for the USCG Ice Breaker Polar Sea (MMSI 367878000).
http://vislab-ccom.unh.edu/~schwehr/Classes/2011/esci895-researchtools/polarsea.xy
What do we have?
-157.031186667,71.3501116667
-157.031095,71.35013
-157.031036667,71.35023
-157.03103,71.3502316667
-157.031018333,71.350235
-157.031008333,71.3502383333
...
This is comma separated longitude and latitude (x,y) positions of the ship from Nov 2008 off of Barrow Alaska courtesy Bryan Thomas of the Barrow Alaska Science Consortium (BASC).
Making a quick Google Earth visualization
We can use python to make a quick Google Earth visualization of the data. Google Earth expects lines to come as a series of points as "x,y" with white space between each point. Our input file is pretty close to this format, so we can just pass through the contents. In the next section, we will do something more complicated. The steps will be:
- Open a file to write to
- Write the KML header and the start of the line
- Write the points for the ship track
- Write the footer / closing KML
- Close the file to make sure it is all on the disk
Here I will use the triple quote (*'''*) to specify strings that span multiple lines. Do not worry about the KML format or what exactly is XML. These topics will be covered in another chapter.
# Open the file for writing
kml = file('polarsea.kml','w')

# Write the header
kml.write('''<?xml version="1.0" encoding="UTF-8"?>
<kml xmlns="http://earth.google.com/kml/2.1">
<Document>
        <Folder>
                <Placemark>
                        <LineString>
                                <coordinates>
''')

# Copy the positions from the data file into the KML file
for line in file('polarsea.xy'):
   kml.write(line)

# Write the closing for the KML
kml.write('''
                                </coordinates>
                        </LineString>
                </Placemark>
        </Folder>
</Document>
</kml>
''')

# Close the file so that we know it has been written
kml.close()
Now open the KML file by double clicking on the file.
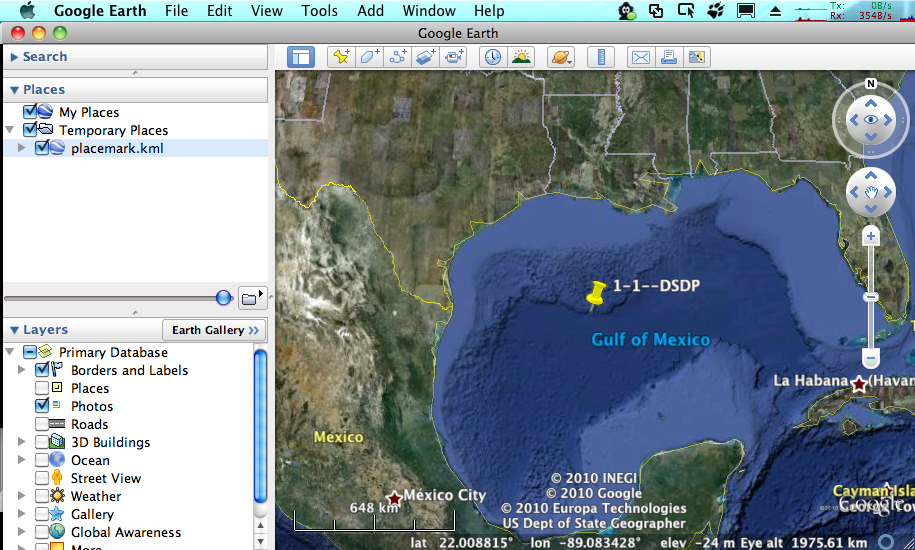
Working with actual data Part 2 - Ocean Drilling "Holes"
Download the data
If you want to try a more advance method to get the data for this section, skip to the next section. The sure fire way to get the data is to open up Firefox or Chrome and go to this URL:
http://vislab-ccom.unh.edu/~schwehr/Classes/2011/esci895-researchtools/
In that directory, you will find "holes.csv". Save it to your desktop.
http://vislab-ccom.unh.edu/~schwehr/Classes/2011/esci895-researchtools/holes.csv
Downloading the data without a web browser
If you want a more challenging way to get the data, python has tools for dealing with web data directly. Start up ipython and try this out.
cd Desktop
import urllib2
webpage = urllib2.urlopen('http://vislab-ccom.unh.edu/~schwehr/Classes/2011/esci895-researchtools/holes.csv')
holes_csv_data = webpage.read()
holes_csv = open('holes.csv', 'w')
holes_csv.write(holes_csv_data)
del holes_csv
You should now have a file "holes.csv" on your desktop.
What have we downloaded?
This file is in the traditional comma separated values (CSV) format. There is a python module designed to handle CVS files, but here we will take care of parsing (aka decoding) the file ourselves.
Expedition,Site,Hole,Program,Longitude,Latitude,Water Depth (m),Core Recovered (m)
1,1,,DSDP,-92.1833,25.8583,2827,50
1,2,,DSDP,-92.0587,23.0455,3572,13
1,3,,DSDP,-92.0433,23.03,3747,47
1,4,,DSDP,-73.792,24.478,5319,15
1,4,A,DSDP,-73.792,24.478,5319,5.8
1,5,,DSDP,-73.641,24.7265,5354,6.4
...
First step - parsing
We need to be able to pull out all of the fields in this file to be able to use it. Unlike our previous data file, we will need to pull it apart to get what we need. Fire up ipython and let's give it a whack on the head.
The file is small enough that we can read in all the lines into a list. Lists are often referred to as arrays or 1D matrices. Elements in a list are accessed by number with square brackets. The first item or element in the list is at position 0.
holes_file = open('holes.csv')

lines = holes_file.readlines()

len(lines)
# Len (aka length) tells us that we have 2969 lines

# Look at the first line
lines[0]
# You will get back the line that contains the field names
# 'Expedition,Site,Hole,Program,Longitude,Latitude,Water Depth (m),Core Recovered (m)\n'

# That first line does not have any data, so take a look at the 2nd
# line, which is element 1 (not 2).
lines[1]
# '1,1,,DSDP,-92.1833,25.8583,2827,50\n'
Now we will look at how to pull apart a line into the pieces that we need. The split method on strings will break it into pieces. By passing in a ',' to split, we can ask it to separate "things" by the comma in between each column.
lines[1].split(',')
# ['1', '1', '', 'DSDP', '-92.1833', '25.8583', '2827', '50\n']

# view the longitude
fields[4]
# '-92.1833'


# Save this in a variable
fields = lines[1].split(',')

# We can now create variables with each field we need
x = fields[4]
y = fields[5]

# We can put together several fields to create a name for this entry
name =  fields[0] + '-' + fields[1] + '-' + fields[2] + '-' + fields[3]
Take a look at the results of our variables that we have ready.
x,y
# ('-92.1833', '25.8583')

name
# '1-1--DSDP'
We can now make a single simple placemark in Google Earth. I've made the KML line simpler than it should be to make this easier to understand, but it should still work.
kml = open('placemark.kml','w')

kml.write('''<?xml version="1.0" encoding="UTF-8"?>
<kml>
<Document>
        <Placemark>
                <name>''')

kml.write(name)

kml.write('''</name>
                <Point>
                        <coordinates>''')

kml.write(x + ',' + y)

kml.write('''</coordinates>
                </Point>
        </Placemark>
</Document>
</kml>''')

kml.close()
Now open the KML file by double clicking on it.
That worked well for one placemark, but we have almost 3000 placemarks that we would like to put on the globe. It's time for a for loop over all the lines in the file. We can put one placemark after the other in the KML file and Google Earth will show all of them.
The formatting in a KML is just for humans (unlike in python), so I will write the KML in a more compact format without indentation.
lines = open('holes.csv').readlines()

kml = open('holes.kml','w')

kml.write('''<?xml version="1.0" encoding="UTF-8"?>
<kml>
<Document>
''')

# We will use a subset of lines to skip the first line
for a_line in lines[1:]:
    fields = a_line.split(',')
    x = fields[4]
    y = fields[5]
    name =  fields[0] + '-' + fields[1] + '-' + fields[2] + '-' + fields[3]
    #
    # You can comment the next line if you do not want to watch it working
    print name, x, y
    #
    kml.write('<Placemark><name>')
    kml.write(name)
    kml.write('</name><Point><coordinates>')
    kml.write(x + ',' + y)
    kml.write('</coordinates></Point></Placemark>')
    kml.write('\n') # This is a new line

# Finish the KML
kml.write('''
</Document>
</kml>''')

kml.close()
Date: $Date: $
HTML generated by org-mode 7.3 in emacs 23