| Author | Title | Year | Journal/Proceedings | Reftype | DOI/URL |
|---|---|---|---|---|---|
| Alexander, L. & Schwehr, K. | Concept: IALA AIS Binary Messages Web site for message Catalog and Register [BibTeX] |
2009 | techreport | ||
BibTeX:
@techreport{alexander2009,
  author = {Alexander, L. and Schwehr, K},
  title = {Concept: IALA AIS Binary Messages Web site for message Catalog and Register},
  year = {2009}
}
|
|||||
| Alexander, L., S.K. | New Standards for Providing Meteorological and Hydrographic Information via AIS Application-Specific Messages | 2010 | International Hydrographic Review Vol. 3, pp. 37-44 |
article | URL |
| Abstract: AIS Application-specific messages transmitted in binary format will be increasingly used to digitally communicate maritime safety/security information between participating vessels and shore stations. This includes time-sensitive meteorological and hydrographic information that is critical for safe vessel transits and efficient ports/waterways management. IMO recently completed a new Safety-of-Navigation Circular (SN/Circ.) that includes a number of meteorologi- cal and hydrographic message applications and data parameters. In conjunction with the development of a new SN/Circ., IMO will establish an International Application (IA) Register for AIS Application-Specific Messages. IALA plans to establish a similar register for regional appli- cations. While there are no specific standards for the presentation/display of AIS application- specific messages on shipborne or shore-based systems, IMO issued guidance that includes specific mention of conforming to the e-Navigation concept of operation. For both IHO S-57 and S-100-related data dealing with dynamic met/hydro information, it is recommended that IHO uses the same data content fields and parameters that are defined in the new IMO SN/Circ. on AIS Application-specific Messages. | |||||
BibTeX:
@article{alexander2010b,
  author = {Alexander, L., Schwehr, K.},
  title = {New Standards for Providing Meteorological and Hydrographic Information via AIS Application-Specific Messages},
  journal = {International Hydrographic Review},
  year = {2010},
  volume = {3},
  pages = {37-44},
  url = {http://vislab-ccom.unh.edu/~schwehr/papers/201005-alexander-schwehr-IHR-MetHydro-ais.pdf}
}
|
|||||
| Alexander, L., S.K.Z.R. | Establishing an IALA AIS Binary Message Register: Recommended Process | 2010 | 17th IALA CONFERENCE, pp. 108-115 | article | URL |
| Abstract: The goal of the Regional AIS Application Specific Message Register is to provide awareness of what applications exist, facilitate harmonization, and promote proper binary messaging for regional applications. To be hosted on the IALA website, establishing the Register will be a 3-step process: 1) Compile all existing AIS binaries into a "collection." Recommendations are provided in regard to: - Benefit of a web-based HTML user interface for input/output. - Benefit of a joint IMO-IALA register for both international and regional applications. |
|||||
BibTeX:
@article{alexander2010a,
  author = {Alexander, L., Schwehr, K. Zetterberg, R.},
  title = {Establishing an IALA AIS Binary Message Register: Recommended Process},
  journal = {17th IALA CONFERENCE},
  year = {2010},
  pages = {108-115},
  url = {http://vislab-ccom.unh.edu/~schwehr/papers/201003-iala-7th-conf-regional-ais.pdf}
}
|
|||||
| Blackmon, T., Henning, P., Neveu, C., Schwehr, K. & Zbinden, E. | Mars Pathfinder Terrain Model Demonstrations | 1997 | SigGraph | inproceedings | |
| Abstract: In the SGI booth. Presented real time fly throughts of Mars Pathfinder Models | |||||
BibTeX:
@inproceedings{blackmon1997,
  author = {Blackmon, T. and Henning, P. and Neveu, C. and Schwehr, K. and Zbinden, E.},
  title = {Mars Pathfinder Terrain Model Demonstrations},
  booktitle = {SigGraph},
  year = {1997}
}
|
|||||
| Braswell, B., Schwehr, K., Milliman, T. & Fisk, J. | Open Geoscience: Using Free and Open Source Software for Research and Education | 2008 | AAG | inproceedings | URL |
| Abstract: Many open source geospatial tools such as UMN MapServer, PostgreSQL/PostGIS, and OpenLayers have been developed over the last few years. These tools provide the building blocks for developing a wide variety of web applications for presenting and using geospatial data. We present a framework for building web applications using these open source tools in earth and environmental research, along with a few case studies. This general framework has been used to build several web applications for use on research projects, including tracking ducks as part of an avian influenza study, monitoring ship traffic in a harbor, mapping weather and climate data, and browsing very large archives of remote sensing data. We will discuss the challenges that we encountered while developing this framework and benefits we have derived from using it. We also plan to incorporate this framework in the classroom, particularly for laboratory and project work in remote sensing, GIS, and data visualization. The involvement of academic researchers in the development of these tools leads to their becoming more easy to use in an academic setting, which provides a compelling reason to attempt to grow support in the research and education community for sharing information and software with one another. We would therefore like to assist fellow scientists and teachers by helping to reduce the knowledge gradient from the centers of data and modeling to the larger user community. | |||||
BibTeX:
@inproceedings{braswell2008,
  author = {Braswell, B. and Schwehr, K. and Milliman, T. and Fisk, J.},
  title = {Open Geoscience: Using Free and Open Source Software for Research and Education},
  booktitle = {AAG},
  year = {2008},
  url = {http://vislab-ccom.unh.edu/~schwehr/papers/braswell2008-aag.txt}
}
|
|||||
| Brennan, R., Gallagher, B., Riley, J., Schwehr, K. & Alexander, L. | Tide Aware ENC: Demonstration of an Operational Concept | 2007 | US Hydro | inproceedings | URL |
| Abstract: The size and draft of ships calling on United States ports has steadily grown over the past 50 years. Today's vessels may be transiting into port with as little as 0.3 meters (one foot) beneath their keel. This increase in the size of the vessel has caused the mariner to ask questions of the chart and its data that the tradition products, both paper and electronic versions, are incapable of answering. An operational solution to this problem may be constructed using existing technologies. High resolution bathymetry and their associated uncertainties provide the foundation for using algorithmic cartography to render the data in new, more intuitive ways. When this high resolution bathymetric foundation is combined with real-time water levels, telemetered to the underway vessel via the Automatic Identification System (AIS), it is possible to create an electronic navigational chart which is capable of displaying a “tide-aware” ship's safe contour to the mariner. Since both the bathymetry and the water level interpolation method have a computed uncertainty value, an expressed uncertainty of the charted display may also be presented. This paper describes an operational model for how this may achieved and discusses results from initial field trials. In particular, tidal information is provided in XML format and relayed via AIS to all vessels underway within radio range of the shoreside AIS transmitter. Once this data is received aboard the vessel, it is utilized by a software engine developed in Coast Survey's Hydrographic Systems and Technology Program (HSTP) which computes a water surface model based on the Tidal Constituent and Residual Interpolation (TCARI) method. This water surface model is then provided to navigation software also developed in HSTP called ECS++ (for Electronic Chart System with enhancements). This software then combines the high resolution bathymetry with the water surface to arrive at a bathymetric model with values representative of the actual water depths. This model is in turn displayed in the ECS++ display window to show the available water within the navigational theater, based on modeled water levels. Using this methodology, ECS++ is capable of estimating the water level at a vessel's position for any location and instance in time. |
|||||
BibTeX:
@inproceedings{brennan2007,
  author = {Brennan, Rick and Gallagher, Barry and Riley, Jack and Schwehr, Kurt and Alexander, Lee},
  title = {Tide Aware ENC: Demonstration of an Operational Concept},
  booktitle = {US Hydro},
  year = {2007},
  note = {Abstract and talk only},
  url = {http://vislab-ccom.unh.edu/~schwehr/papers/2007-brennan-ushydro-abstract.doc}
}
|
|||||
| Cabrol, N.A., Chong-Diaz, G., Dohm, J.M., Pereira Arredondo, M., Dunfield, G., Gulick, V.C., Jensen-Iglesia, A., Keaten, R., Herrera Lamelli, C., Landheim, R., Lee, P.C., Pederson, L., Roush, T., Schwehr, K., Stoker, C.R. & Zent, A. | Atacama I: Science Results of the 1997 Nomad Rover Field Test in the Atacama Desert, Chile | 1998 | Vol. 29Lunar and Planetary Institute Conference Abstracts, pp. 1013 |
inproceedings | URL |
| Abstract: The Nomad rover was deployed for 45 days in the Atacama Desert, Chile, during the summer of 1997. During this period, the rover set the record of the longest traverse ever performed by an automated vehicle (220 km), while controlled by operators either at NASA Ames and Carnegie Mellon. During this traverse, between June 20th and 27th, the rover was used to perform science experiments. Both Science and Operation Team controlling the rover were located at NASA Ames, while a Field Science Team was in the Chilean Desert to ground-truth the operations. The Atacama Desert: The Atacama desert includes a variety of features and characteristics that make this site a unique place to perform experiments on planetary-analog surfaces (i.e., Mars and the Moon): craters from meteoritic impacts, volcanoes, rocks and sand fields, total lack of vegetation due to the absence of rain (1 cm/year from fog), ancient - and now dry - lake beds and sea floor. The average elevation of the test area (23°20’N/68°37’W) was 2400 m, and the diurnal temperature variation from 0° to 25°C. The terrain offered challenges to test the vehicle mobility and trafficability capacities, with a succession of soft surfaces due to the accumulation of smooth materials, and ravines left by ancient channels currently dry which eroded the desert in the past. Overall Project and Science Objectives: The field test was designed to demonstrate and validate: (a) robust locomotion, navigation, visualization, and communication in a long-distance, long-duration traverse in Chile’s Atacama desert, (b) perform end-to-end trial under remote control; teleoperation and autonomous control with simulated time delays. The objectives pertaining to the NASA Ames science field experiment were to: (1) provide realistic desert experience for remote operators through highquality imagery, (2) simulate NASA missions (Mars, Moon, and Antarctica) by: (a) training scientists, (b) evaluating control environment appropriateness, (c) developing and evaluating exploration strategies, (d) evaluating best interaction by distributed science teams, (3) evaluate the importance of various image techniques, i.e., panospheric imaging, pan/tilt camera, stereo imaging, close-up imagery, (4) understand the reasons of data misinterpretation in previous field experiments by ground-truthing with feedback to the Science Team at NASA Ames, and careful evaluation of scientists’ procedures and protocols. Nomad Rover: Capabilities and Science Package: Nomad is a four-wheel drive, four-wheel steer robust rover (wheel diameter: 76.2 cm), of 2.4 x 2.4 x 2.4 m deployed, and 550 kg mass, with a transformable chassis. The rover used an actively pointed antenna to support high-bandwidth telemetry [1], [2]. Nomad’s average speed was 0.3 m/sec, though it was able to sustain 0.5 m/sec during the simulated Mars and Moon operations in open terrain. Navigation was enabled by Inertia Measurement Unit, Gyrocompass, and Global Positioning System (GPS), with a precision of about one meter. The imagery system included a panoramic camera with an ultrawide field of view (360° x 40° above horizontal) using a spherical mirror mounted above the vertically oriented digital camera [3]. The science imaging system (high resolution cameras) was designed to reach the resolution of the human eye (see specifications below): • Color Stereo Cameras: 640x480 pxl; 0.29865 mrad/pxl; 8 x 11° FoV; 8 bit per color (24 total); left/right stereo separation: 25 cm; • Black and White Stereo Cameras: 640x480 pxl; 0.895 mrad/pxl; 25 x 33° full FoV; left/right stereo separation: 12.5 cm; • Panospheric Camera: 1024 x 1024 pxl; 360° FoV; 1 Mbyte per image; • Science Instrument: Magnetometer: sled dragged behind Nomad on rigid towbar; sensor footprint: 8” at 13 cm. • Aerial Photos: 1 m/pxl resolution • Weather Sensors: Temperature; humidity, wind velocity. Exploration Strategies: The goal was to prepare near-term planetary missions by testing different exploration strategies. The planetary mission scenarios included: (1) Mars Caching Samples by a thorough examination of the sites, with and without panospheric | |||||
BibTeX:
@inproceedings{cabrol1998a,
  author = {Cabrol, N. A. and Chong-Diaz, G. and Dohm, J. M. and Pereira Arredondo, M. and Dunfield, G. and Gulick, V. C. and Jensen-Iglesia, A. and Keaten, R. and Herrera Lamelli, C. and Landheim, R. and Lee, P. C. and Pederson, L. and Roush, T. and Schwehr, K. and Stoker, C. R. and Zent, A.},
  title = {Atacama I: Science Results of the 1997 Nomad Rover Field Test in the Atacama Desert, Chile},
  booktitle = {Lunar and Planetary Institute Conference Abstracts},
  year = {1998},
  volume = {29},
  pages = {1013},
  url = {http://vislab-ccom.unh.edu/~schwehr/papers/atacamaI.pdf}
}
|
|||||
| Cabrol, N.A., Chong-Diaz, G., Dohm, J.M., Pereira Arredondo, M., Dunfield, G., Gulick, V.C., Jensen-Iglesia, A., Keaten, R., Herrera Lamelli, C., Landheim, R., Lee, P.C., Pederson, L., Roush, T., Schwehr, K., Stoker, C.R. & Zent, A. | Atacama II: Nomad Rover Sample 1-250697 and implications for fossil characterization during Mars exploration | 1998 | Vol. 29Lunar and Planetary Institute Conference Abstracts |
inproceedings | URL |
| Abstract: SAMPLE 1-250697 AND FOSSIL CHARACTERIZATION FOR MARS: Cabrol et al., The first section cut (figure 2) further supported the Field and ARC Science Teams earlier interpretations: the plan and longitudinal views of a dome through structure were consistent with the algae hypothesis. Thin sections of the chert and carbonate portions of the sample were then prepared (figures 3 and 4). Figure 3: Thin section through chertified dome structure with no visible fossils or remnant structures. Figure 4: Thin section through carbonate matrix. 1) Crystalline carbonate cement, 2) mafic accessory minerals (primarily pyrite), and 3) carbonate matrix. Note: limonite alteration of mafic accessory mineral seen as opaque veins. No evidence verifying the algal mat hypothesis was observed in any of the thin sections. However, it is possible that any biogenic structure that may have existed (strongly suggested by the environment of nearshore algal carpet of Site 4), may have been totally replaced without preserving any biogenic features. Unless we find conclusive evidence of fossil algal material within other thin sections, we could not confirm the possible biogenic origin of the structures observed in this terrestrial sample. For the coming Mars rover exploration missions focusing on the search for life, the fossil identification of sample 1-250697 suggests that even a comprehensive field and laboratory identification process can lead to inconclusive results. This has several critical implications for to the exobiologic investigation of Mars: (1) After the sample return, we can be holding remnants of Martian life in our hands and not have the tools to recognize it. A typical example is the Alan Hills meteorite ALH 84001, for which the current technology cannot confirm or rule out the hypothesis of nanobacteria. It can be argued that a sophisticated imagery system will be the most effective tool to identify life on Mars, which leads to the second implication of the Nomad field test. (2) Site 4 indicated that the imagery system was an important strategic and tactical tool, the utility of which can not be denied in a reconnaissance of surface fossil records. If Nomad had carried spectrometers, biological experiments, and to the extreme, a thin-section device, it is likely that the fossil identification results of sample 1-250697 would have been similarly inconclusive. In the context of Mars exploration with probably very similar environments (lake shoreline, altered iron-rich carbonate units), the primary tools for the rover reconnaissance and selection of potential study areas will remain the imagery system. Using only the imagery system, correct area characterization of the geology and stratigraphy led the Science Team to Site 4 and then to spot sample 1-250697 on the fossiliferous unit, thus breaking the barrier of misinterpretation of the previous rover field tests. Powerful rover-mounted cameras will be the tools that identify likely fossiliferous units and any “suspicious rocks” within them. This is relevant for the next rover mission that will carry the Athena science package. The experience of previous tests, where the camera resolution was inferior to Nomad’s imagery system, showed that using less powerful resolution than Nomad’s for Mars would result in diminished chances of success. (3) Finally, we would like to emphasize that flexibility in traverse science planning and ability to re-evaluate mission priorities are probably important keys for success. During the science on the fly operation, the Science Team was focused on keeping the rover moving, and obtaining the best geologic interpretation at the same time. Once the images of 1-250697 taken, the rover was sent to another target, leaving the Science Team with a cached “suspicious rock”. In the interpreted near-shore environment, the discovery of possible fossil algal mat structure could have triggered a more comprehensive study of Site 4. Futher study of site 4 would have revealed non-ambiguous macrofossil evidence, i.e., coquina. Acknowledgment: Thank to all the people that made this experiment possible (see Atacama I). A special thanks to: T. Bunch, R. Mancinelli, J. Farmer (NASA ARC), C. Stevens (San Jose Sate University) and D. Lowe (Stanford University) for providing their expertise during the analysis of sample 1-250697. | |||||
BibTeX:
@inproceedings{cabrol1998b,
  author = {Cabrol, N. A. and Chong-Diaz, G. and Dohm, J. M. and Pereira Arredondo, M. and Dunfield, G. and Gulick, V. C. and Jensen-Iglesia, A. and Keaten, R. and Herrera Lamelli, C. and Landheim, R. and Lee, P. C. and Pederson, L. and Roush, T. and Schwehr, K. and Stoker, C. R. and Zent, A.},
  title = {Atacama II: Nomad Rover Sample 1-250697 and implications for fossil characterization during Mars exploration},
  booktitle = {Lunar and Planetary Institute Conference Abstracts},
  year = {1998},
  volume = {29},
  url = {http://vislab-ccom.unh.edu/~schwehr/papers/atacamaII.pdf}
}
|
|||||
| Cabrol, N.A., Chong-Diaz, G., Dohm, J.M., Pereira Arredondo, M., Dunfield, G., Gulick, V.C., Jensen-Iglesia, A., Keaten, R., Herrera Lamelli, C., Landheim, R., Lee, P.C., Pederson, L., Roush, T., Schwehr, K., Stoker, C.R. & Zent, A. | Atacama III: meteorite search during the Nomad field tests: perspectives on automated field operations by teleoperated vehicles in extreme environments | 1998 | Lunar and Planetary Institute Conference Abstracts | inproceedings | URL |
| Abstract: Exploring ways to use automated vehicles to search for meteorites in extreme environments was one of the components of the 1997 Nomad Field Experiment. The purpose of this operation was to test visual and instrumental methods that will help to identify meteorites, and to explore new strategies that could benefit the meteorite search program in regions were sustaining the human presence is associated with risks. The rover located in the Atacama desert, Chile [1], was remotely operated from the NASA Ames Research Center. Two different types of operations were planned: (1) a visual search, using the imaging system onboard Nomad of meteorites planted on the field, (2) an instrumental search, using a magnetometer (see figure below). Fig.: The sensor was pulled behind Nomad, a position which proved not being optimal for a precise localization of the suspected meteorites. The presence of the panospheric camera minimized the inconvenience by enabling the Science Team to look backward. Rover Search Equipment: For the search in visual mode, the Science Team was using the rover imagery system capabilities [1], including the panospheric, stereo- color, stereo black and white, and close-up cameras. For the instrumental mode, Nomad was equipped with a towed sensor sled, with the following specifications: (a) Sled: about 15 cm thick 0.30 x 0.30 m HDPE (non metallic) sliding platform with a 2.40 m towbar, attached to the rear of Nomad, 0.9 m lip around front and side to surmount obstacles, (b) JW Fisher Pulse 8x metal, 0.20 m diameter search coil in the center of the platform. The sensitivy varied depending on the size and composition of the target, and was particularly sensitive to iron, (c) Two applied Physics Systems 3 axis magnetometers. The FSD was 1/6th of the earth field. They were mounted on post at the rear of the sled, behind the metal detector. One was mounted 10 cm from the ground (search sensor), and the other was about 5 cm up (reference sensor). The data were processed onboard the rover. The positioning of the sensor at the rear of the rover induced specific maneuver constraints that led the Science Team to recommend the sensor setting on the front of the vehicle for future operations. For instance, backward maneuvers were to be avoided, and the rover could not execute prolonged tight (inferior to 5-m radius) turns, as the towbar could have been snagged by the wheel. The Visual Search Strategy: The operation was limited to a 500 m2 area, in which three meteorites had been planted randomly. The number, size, composition, and position of the meteorites were not known by the Science Team at NASA Ames. Without this information, the strategy used was to try first to characterize the local geology in order to identify the meteorites, (i.e., by they morphology, texture, color that might be different from local rocks). The geology and morphology were, thus, analyzed in the surroundings of the search area, and also jointly during the search operation as the rover was moving along. The local geology at the base of the hills (see figure) was defined as colluvial and alluvial material. [2] Then, the Science Team decided to conduct the meteorite search following the standard strategy adopted by the US Antarctic Search for Meteorites program, ANSMET, (i.e., to perform a grid search by examining the ground in the immediate vicinity of the rover while traversing the search area in a zigzag pattern). Forward-facing high-resolution images of the ground were acquired at each stop, and every image was examined for any unusual object (i.e., morphology, geology, or texture) of resolvable size. Given the limited time available the stopping interval was relaxed to stopping only when a candidate meteorite was spotted while roving continuously. Although this approach might lead to overlooking a number of smaller-sized meteorites, this strategy was deemed preferable as it maximized the area covered in the time available, and hence, optimized chances of finding larger, easier-torecognize meteorites. Results of the Visual Search Mode: Three candidate meteorites, hereafter designated M1, M2, and M3 were encountered during the second track. The rocks were first seen in the forward direction in panoramic scenes, and then scrutinized using the close-up high-resolution color imagery, for shape, and texture characteristics. They appeared as relatively large and dark objects, contrasting with the smaller-sized, and/or lighter-colored background. M1 was revealed to be a dark-brown object, about 10 cm across, with relatively planar facets, rounded angles, and distinct thumb-sized (1-2 cm across) dimples on the facets (see figure below), suggesting the possibility of an iron-meteorite, the dimples being the reminiscent of regmaglyphs (shallow depressions characteristic of iron-meteorites, formed by erosion of their surface by turbulent vortices during atmospheric entry). | |||||
BibTeX:
@inproceedings{cabrol1998c,
  author = {Cabrol, N. A. and Chong-Diaz, G. and Dohm, J. M. and Pereira Arredondo, M. and Dunfield, G. and Gulick, V. C. and Jensen-Iglesia, A. and Keaten, R. and Herrera Lamelli, C. and Landheim, R. and Lee, P. C. and Pederson, L. and Roush, T. and Schwehr, K. and Stoker, C. R. and Zent, A.},
  title = {Atacama III: meteorite search during the Nomad field tests: perspectives on automated field operations by teleoperated vehicles in extreme environments},
  booktitle = {Lunar and Planetary Institute Conference Abstracts},
  year = {1998},
  url = {http://vislab-ccom.unh.edu/~schwehr/papers/atacamaIII.pdf}
}
|
|||||
| Cabrol, N.A., Chong-Diaz, G., Stoker, C.R., Gulick, V.C., Landheim, R., Lee, P., Roush, T., Zent, A., Herrera Lamelli, C., Jensen-Iglesia, A., Pereira Arredondo, M., Dohm, J.M., Keaten, R., Wettergreen, D., Sims, M., Schwher, K., Bualat, M., Thomas, H., Zbinden, E., Christian, D., Pedersen, L., Bettis III, A., Thomas, G. & Witzke, B. | Nomad Rover Field Experiment, Atacama Desert, Chile: 1. Science results overview | 2001 | Journal of Geophysical Research Vol. 106(E4), pp. 7785-7806 |
article | DOI URL |
| Abstract: Nomad was deployed for a 45 day traverse in the Atacama Desert, Chile, during the summer of 1997. During this traverse, 1 week was devoted to science experiments. The goal of the science experiments was to test different planetary surface exploration strategies that included (1) a Mars mission simulation, (2) a science on the fly experiment, where the rover was kept moving 75% of the operation time. (The goal of this operation was to determine whether or not successful interpretation of the environment is related to the time spent on a target. The role of mobility in helping the interpretation was also assessed.) (3) a meteorite search using visual and instrumental methods to remotely identify meteorites in extreme environments, and (4) a time-delay experiment with and without using the panospheric camera. The results were as follow: the remote science team positively identified the main characteristics of the test site geological environment. The science on the fly experiment showed that the selection of appropriate targets might be even more critical than the time spent on a study area to reconstruct the history of a site. During the same operation the science team members identified and sampled a rock from a Jurassic outcrop that they proposed to be a fossil. The presence of paleolife indicators in this rock was confirmed later by laboratory analysis. Both visual and instrumental modes demonstrated the feasibility, in at least some conditions, of carrying out a field search for meteorites by using remote-controlled vehicles. Finally, metrics collected from the observation of the science team operations, and the use team members made of mission data, provided critical information on what operation sequences could be automated on board rovers in future planetary surface explorations. | |||||
BibTeX:
@article{cabrol2001,
  author = {Cabrol, N. A. and Chong-Diaz, G. and Stoker, C. R. and Gulick, V. C. and Landheim, R. and Lee, P. and Roush, T. and Zent, A. and Herrera Lamelli, C. and Jensen-Iglesia, A. and Pereira Arredondo, M. and Dohm, J. M. and Keaten, R. and Wettergreen, D. and Sims, M. and Schwher, K. and Bualat, M. and Thomas, H. and Zbinden, E. and Christian, D. and Pedersen, L. and Bettis III, A. and Thomas, G. and Witzke, B.},
  title = {Nomad Rover Field Experiment, Atacama Desert, Chile: 1. Science results overview},
  journal = {Journal of Geophysical Research},
  year = {2001},
  volume = {106},
  number = {E4},
  pages = {7785-7806},
  note = {http://www.agu.org/journals/ABS/2001/1999JE001166.shtml},
  url = {http://vislab-ccom.unh.edu/~schwehr/papers/Cabrol-etal-2001-JGR.pdf},
  doi = {http://dx.doi.org/10.1029/1999JE001166}
}
|
|||||
| Calder, B. & Schwehr, K. | Traffic Analysis for the Calibration of Risk Assessment Methods | 2009 | US Hydro | article | URL |
| Abstract: In order to provide some measure of the uncertainty in- herent in the sorts of charting data that are provided to the end-user, we have previously proposed risk mod- els that measure the magnitude of the uncertainty for a ship operating in a particular area. Calibration of these models is essential, but the complexity of the models means that we require detailed information on the sorts of ships, traffic patterns and density within the model area to make a reliable assessment. In the- ory, the ais system should provide this information for a suitably instrumented area. We consider the problem of converting, filtering and analysing the raw ais traffic to provide statistical characterizations of the traffic in a particular area, and illustrate the method with data from 2008-10-01 through 2008-11-30 around Norfolk, VA. We show that it is possible to automatically con- struct aggregate statistical characteristics of the port, resulting in distributions of transit location, termina- tion and duration by vessel category, as well as type of traffic, physical dimensions, and intensity of activity. We also observe that although 60 days give us suffi- cient data for our immediate purposes, a large propor- tion of it—up to 52% by message volume—must be considered dubious due to difficulties in configuration, maintenance and operation of ais transceivers. | |||||
BibTeX:
@article{calder2009,
  author = {Calder, B and Schwehr, K},
  title = {Traffic Analysis for the Calibration of Risk Assessment Methods},
  journal = {US Hydro},
  year = {2009},
  url = {http://vislab-ccom.unh.edu/~schwehr/papers/2009ushydro-calder_schwehr_AIS_Traffic_Analysis.pdf}
}
|
|||||
| Center, C.R.R. | Opening the Arctic Seas: Envisioning Disasters and Framing Solutions | 2009 | techreport | URL | |
| Abstract: The Coastal Response Research Center, a partnership between the National Oceanic and Atmospheric Administration (NOAA) Office of Response and Restoration (ORR) and the University of New Hampshire (UNH), develops new approaches to spill response and restoration through research and synthesis of information. The Center’s mission requires it to serve as a hub for research, development, and technology transfer to the oil spill community. To better guide future efforts, the Center, in cooperation with the U.S. Coast Guard Office of Spill Planning and Preparedness and the U.S. Arctic Research Commission, hosted a workshop to identify key strategies, action items, and research needs for preparedness and response to potential Arctic marine incidents. The March 2008 workshop, entitled “Opening the Arctic Seas: Envisioning Disasters and Framing Solutions,” was held at the University of New Hampshire in Durham, NH. This report provides a qualitative analysis of risk factors for five potential marine incidents likely to happen as shipping, tourism, exploration and development of natural resources (e.g., oil, gas, minerals) occur with the retreating Arctic ice cover. Workshop participants represented a broad spectrum of constituencies and expertise including governmental agencies, industry, non- governmental organizations and indigenous people from the Arctic nations. Incidents envisioned involved shipping (i.e., vessels caught in ice, collisions), oil spills, search and rescue, environmental damage, and disruption of indigenous communities. Research priorities were identified by workshop participants to address gaps in preparedness and response for these types of incidents. The report is designed to serve as a resource for funding entities and a tool to inform the Arctic nations and the Arctic Council about how to proceed to avoid the disasters that could result from our current state of unpreparedness. | |||||
BibTeX:
@techreport{crrc2009,
  author = {Coastal Response Research Center},
  title = {Opening the Arctic Seas: Envisioning Disasters and Framing Solutions},
  year = {2009},
  note = {Un-named contributor},
  url = {http://vislab-ccom.unh.edu/~schwehr/papers/200901-arctic_summit_report_final.pdf}
}
|
|||||
| Christian, D., Schwehr, K., Zbinden, E., Sims, M. & Stoker, C.R. | Demonstration of the Ames Marsokhod Rover [BibTeX] |
1997 | Rover Roundup | inproceedings | |
BibTeX:
@inproceedings{christian1997b,
  author = {Christian, D. and Schwehr, K. and Zbinden, E. and Sims, M. and Stoker, C. R.},
  title = {Demonstration of the Ames Marsokhod Rover},
  booktitle = {Rover Roundup},
  publisher = {Planetary Society},
  year = {1997}
}
|
|||||
| Christian, D., Wettergreen, D., Bualat, M., Schwehr, K., Tucker, D. & Zbinden, E. | Field Experiments with the Ames Marsokhod Rover | 1997 | Field and Service Robotics | inproceedings | URL |
| Abstract: In an ongoing series of field experiments, the Ames Marsokhod rover is deployed to remote locations and operated by scientists in simulated planetary explorations. These experiments provide insight both for scientists preparing for real planetary surface exploration and for robotics researchers. In this paper we will provide an overview of our work with the Marsokhod, describe the various subsystems that have been developed, discuss the latest in a series of eld experiments, and discuss the lessons learned about performing remote geology. | |||||
BibTeX:
@inproceedings{christian1997,
  author = {Christian, D. and Wettergreen, D. and Bualat, M. and Schwehr, K. and Tucker, D. and Zbinden, E.},
  title = {Field Experiments with the Ames Marsokhod Rover},
  booktitle = {Field and Service Robotics},
  year = {1997},
  url = {http://vislab-ccom.unh.edu/~schwehr/papers/marsokhod-fsr97.pdf}
}
|
|||||
| Constant, B. | Seismic-Sites: a Web-based Field Guide to the Faults of Southern California | 2004 | Southern California Earthquake Center Anual Meeting | inproceedings | URL |
| Abstract: Seismologists who grew up in California in the 1960s can probably trace their interest in the subject to the book Earthquake Country by Robert Iacopi (1964), which explains why California has earthquakes and how to live with them. This book also includes a driving guide to the major faults, giving readers directions for driving along, for example, the San Andreas fault, with accompanying descriptive text. We emulate the travel part of Iacopis book, using the SCEC web portal interface titled the Community Organized Resource Environment (CORE; http://www.scec.org/core/) to help create a virtual field guide of the San Diego region. Our contribution to CORE consists of a Seismic-Sites module that provides an online catalog of geologic photos, maps, web-links, references, anaglyph and panoramic images and instructions on how to reach noteworthy destinations along easily accessible roads. In the long term these data will be freely available to anyone with internet access, including weekend road trippers and geology classes. In this way, one can design their own field trip with a few clicks of the mouse. Our 2004 summer Seismic-Sites project (conducted by UCSD undergraduate students Alex James and Ben Constant, with additional assistance from high school student Evan Morikawa) focuses on fault features in the San Diego region. We are currently experimenting with augmenting these catalogs with additional features including a 3D interactive scene file of the region (topography, bathymetry, seismicity, and geo-referenced photographs) that can be downloaded and run on any platform using the freeware iView3D (http://www.siovizcenter.ucsd.edu/library/objects/index.php). | |||||
BibTeX:
@inproceedings{constant2004,
  author = {Constant, Ben},
  title = {Seismic-Sites: a Web-based Field Guide to the Faults of Southern California},
  booktitle = {Southern California Earthquake Center Anual Meeting},
  year = {2004},
  url = {http://vislab-ccom.unh.edu/~schwehr/papers/constant-etal2004-SCEC-sml.jpg}
}
|
|||||
| Curcio, J., McGillivary, P.A., Fall, K., Maffei, A., Schwehr, K., Twiggs, B., Kitts, C. & Ballou, P. | Self-Positioning Smart Buoys, The "Un-Buoy" Solution: Logistic Considerations using Autonomous Surface Craft Technology and Improved Communications Infrastructure | 2006 | IEEE MTS, pp. 5 | inproceedings | URL |
| Abstract: Moored buoys have long served national interests, but come with high development, construction, installation, and maintenance costs. Buoys which drift off-location can pose hazards to mariners, and in coastal waters may cause environmental damage. Moreover, retrieval, repair and replacement of drifting buoys may be delayed when data would be most useful. Such gaps in coastal buoy data can pose a threat to national security by reducing maritime domain awareness. The concept of self-positioning buoys has been advanced to reduce installation cost by eliminating mooring hardware. We here describe technology for operation of reduced cost self-positioning buoys which can be used in coastal or oceanic waters. The ASC SCOUT model is based on a selfpropelled, GPS-positioned, autonomous surface craft that an be pre-programmed, autonomous, or directed in real time. Each vessel can communicate wirelessly with deployment vessels and other similar buoys directly or via satellite. We here include discussion of the advanced Delay Tolerant Networking (DTN) wireless communications draft protocol which offers improved wireless communication capabilities both underwater, to adjacent vessels, and to satellites. DTN is particularly adapted for noisy or loss-prone environments, thus it improves reliability. In addition to existing buoy communication via commercial satellites, a growing network of small satellites known as PICOSATs can be readily adapted to provide low-cost communications nodes for buoys. Engineering options for short or longer term power requirements are considered, in addition to future options for improved energy delivery systems. Methods of reducing buoy drift and position-maintaining energy requirements for self-locating buoys are also discussed, based on the potential of incorporating traditional maritime solutions to these problems. Coordination with planned vessel Automated Identification Systems (AIS) and International Maritime Organization standards for buoy and vessel notification systems are reviewed and the legal framework for deployment of autonomous surface vessels is considered. | |||||
BibTeX:
@inproceedings{curcio2006,
  author = {Curcio, Joseph and McGillivary, Philip A. and Fall, Kevin and Maffei, Andy and Schwehr, Kurt and Twiggs, Bob and Kitts, Chris and Ballou, Phil},
  title = {Self-Positioning Smart Buoys, The "Un-Buoy" Solution: Logistic Considerations using Autonomous Surface Craft Technology and Improved Communications Infrastructure},
  booktitle = {IEEE MTS},
  year = {2006},
  pages = {5},
  url = {http://vislab-ccom.unh.edu/~schwehr/papers/2006ieee-mts-PID286374.pdf}
}
|
|||||
| Garcia, L. & Schwehr, K. | Propsal to the Philippine Government for the Widespread Use of Ethanol as an Automotive Fuel | 1991 | techreport | URL | |
| Abstract: Although the twenty-two proposed geothermal plants would provide the Philippines with much needed energy and a decreased dependence on foreign oil, we believe that the Philippines should instead convert excess sugar cane (biomass) to ethanol fuel for cars because the geothermal plants will cause a great deal of damage to the Philippine rainforests. | |||||
BibTeX:
@techreport{garcia1991,
  author = {Garcia, L. and Schwehr, K.},
  title = {Propsal to the Philippine Government for the Widespread Use of Ethanol as an Automotive Fuel},
  year = {1991},
  note = {This was a paper done for a class project},
  url = {http://vislab-ccom.unh.edu/~schwehr/papers/PhilipinesEthanol1991.txt}
}
|
|||||
| Group, I.A.B.M.C. | Revision of the Guidance on the Application of AIS Binary Messages, Report from the AIS Binary Messages Correspondence Group, Annex 1, Guidance on the use of AIS Application Specific Messages | 2009 | IMO NAV 55 conference | article | URL |
| Abstract: Automatic Identification System (AIS) was originally developed as a means for positive identification and tracking of vessels. This was accomplished by transmitting and receiving static, dynamic, and voyage-related data about ships, as well as short safety-related messages. In addition, AIS is beneficial to the safety-of-navigation and protection of the environment by monitoring the maritime traffic and by providing various basic services. In particular, AIS may use binary messages for transmission of Application Specific Messages as a means for certain types of limited communications. Various types of messages were developed for specific applications. | |||||
BibTeX:
@article{nav55,
  author = {IMO AIS Binary Message Correspondence Group},
  title = {Revision of the Guidance on the Application of AIS Binary Messages, Report from the AIS Binary Messages Correspondence Group, Annex 1, Guidance on the use of AIS Application Specific Messages},
  journal = {IMO NAV 55 conference},
  year = {2009},
  note = {Submitted by Sweden},
  url = {http://vislab-ccom.unh.edu/~schwehr/papers/2009-Nav55-CG-AIX-Report-Annex1.pdf}
}
|
|||||
| Hatch, L., Clark, C., Merrick, R., Van Parijs, S., Ponirakis, D., Schwehr, K., Thompson, M. & Wiley, D. | Characterizing the Relative Contributions of Large Vessels to Total Ocean Noise Fields: A Case Study Using the Gerry E. Studds Stellwagen Bank National Marine Sanctuary | 2008 | Environmental Management | article | URL |
| Abstract: In 2006, we used the U.S. Coast Guard’s Automatic Identification System (AIS) to describe patterns of large commercial ship traffic within a U.S. National Marine Sanctuary located off the coast of Massachusetts. We found that 541 large commercial vessels transited the greater sanctuary 3413 times during the year. Cargo ships, tankers, and tug/tows constituted 78% of the vessels and 82% of the total transits. Cargo ships, tankers, and cruise ships predominantly used the designated Boston Traffic Separation Scheme, while tug/tow traffic was concentrated in the western and northern portions of the sanctuary. We combined AIS data with low-frequency acoustic data from an array of nine autonomous recording units analyzed for 2 months in 2006. Analysis of received sound levels (10–1000 Hz, root-mean-square pressure re 1 lPa ± SE) averaged 119.5 ± 0.3 dB at high-traffic locations. High- traffic locations experienced double the acoustic power of less trafficked locations for the majority of the time period analyzed. Average source level estimates (71–141 Hz, root- mean-square pressure re 1 lPa ± SE) for individual vessels ranged from 158 ± 2 dB (research vessel) to 186 ± 2 dB (oil tanker). Tankers were estimated to contribute 2 times more acoustic power to the region than cargo ships, and more than 100 times more than research vessels. Our results indicate that noise produced by large commercial vessels was at levels and within frequencies that warrant concern among managers regarding the ability of endangered whales to maintain acoustic contact within greater sanctuary waters. | |||||
BibTeX:
@article{hatch2008a,
  author = {Hatch, L. and Clark, C. and Merrick, R. and Van Parijs, S. and Ponirakis, D. and Schwehr, K. and Thompson, M. and Wiley, D.},
  title = {Characterizing the Relative Contributions of Large Vessels to Total Ocean Noise Fields: A Case Study Using the Gerry E. Studds Stellwagen Bank National Marine Sanctuary},
  journal = {Environmental Management},
  year = {2008},
  url = {http://vislab-ccom.unh.edu/~schwehr/papers/hatch2008-vessel-noise.pdf}
}
|
|||||
| IMO | Guidance on the Use of AIS Application-Specific Messages | 2010 | IMO Vol. SN.1/Circ.289, Ref. T2-OSS/2.7.1, pp. 74 |
article | URL |
| Abstract: The Maritime Safety Committee, at its seventy-eighth session (12 to 21 May 2004), approved SN/Circ.236 on Guidance on the application of AIS binary messages as prepared by the Sub-Committee on Safety of Navigation at its forty-ninth session (30 June to 4 July 2003). The Sub-Committee on Safety of Navigation, at its forty-ninth session (30 June to 4 July 2003), selected seven (7) binary messages as shown in annex 2 to SN/Circ.236 to be used as a trial set of messages for a period of four years with no change. Itwas noted that four additional system-related messages were identified in Recommendation ITU-R M.1371 for the operation of the system. The Sub-Committee on Safety of Navigation, at its fifty-fifth session (27 to 31 July 2009), after evaluating the use of binary messages in the trial period defined in SN/Circ.236, agreed on Guidance on the use of AIS Application-Specific Messages, including messages which are recommended for international use. The Maritime Safety Committee, at its eighty-seventh session (12 to 21 May 2010), concurred with the Sub-Committee's views and approved the Guidance on the use of AIS Application Specific Messages, as set out at annex. Member Governments are invited to bring the annexed Guidance to the attention of all concerned. This circular revokes SN/Circ.236 as from 1 January 2013. |
|||||
BibTeX:
@article{imo2010a,
  author = {IMO},
  title = {Guidance on the Use of AIS Application-Specific Messages},
  journal = {IMO},
  year = {2010},
  volume = {SN.1/Circ.289, Ref. T2-OSS/2.7.1},
  pages = {74},
  note = {Un-named contributor},
  url = {http://vislab-ccom.unh.edu/~schwehr/papers/2010-IMO-SN.1-Circ.289.pdf}
}
|
|||||
| IMO | Guidance for the Presentation and Display of AIS Application-Specific Messages Information | 2010 | IMO Vol. IMO, SN.1/Circ.290, Ref. T2-OSS/2.7.1, pp. 10 |
article | URL |
| Abstract: The Maritime Safety Committee, at its seventy-eighth session (12 to 21 May 2004), approved SN/Circ.236 on Guidance on the application of AIS binary messages as prepared by the Sub-Committee on Safety of Navigation, at its forty-ninth session (30 June to 4 July 2003). The Sub-Committee on Safety of Navigation, at its forty-ninth session, selected seven (7) Application-Specific Messages as shown in annex 2 to SN/Circ.236 to be used as a trial set of messages for a period of four years with no change. It was noted that four additional system-related messages were identified in Recommendation ITU-R M.1371 for the operation of the system. The Sub-Committee on Safety of Navigation (NAV), at its fifty-fifth session (27 to 31 July 2009), after evaluating the use of Application-Specific Messages in the trial period defined in SN/Circ.236, agreed on Guidance for the presentation and display of AIS Application-Specific Messages information. The Maritime Safety Committee, at its eighty-seventh session (12 to 21 May 2010), concurred with the Sub-Committee's views and approved the Guidance for the presentation and display of AIS Application-Specific Messages information, as set out in the annex. Member Governments are invited to bring the annexed Guidance to the attention of all concerned. |
|||||
BibTeX:
@article{imo2010b,
  author = {IMO},
  title = {Guidance for the Presentation and Display of AIS Application-Specific Messages Information},
  journal = {IMO},
  year = {2010},
  volume = {IMO, SN.1/Circ.290, Ref. T2-OSS/2.7.1},
  pages = {10},
  note = {Un-named contributor},
  url = {http://vislab-ccom.unh.edu/~schwehr/papers/2010-IMO-SN.1-Circ.290.pdf}
}
|
|||||
| Jacobi, M., Kinner, N.E., Braswell, B., Schwehr, K., Newman, K.S. & Merten, A.A. | Environmental Response Management Application | 2008 | Interational Oil Spill Conference | inproceedings | URL |
| Abstract: The Coastal Response Research Center (CRRC), a partnership between the University of New Hampshire (UNH) and NOAA's Office of Response and Restoration (ORR), is leading an effort to develop a data platform capable of interfacing both static and real-time data sets accessible simultaneously to a command post and assets in the field with an open source internet mapping server. The Environmental Response Management Application (ERMA™) is designed to give responders and decision makers ready access to geographically specific data useful during spill planning/drills, incident response, damage assessment and site restoration. In addition to oil spill and chemical release response, this website can be relevant to other environmental incidents and natural disasters, responses and regional planning efforts. The platform is easy to operate, without the assistance of Information Technology or Geographic Information Systems (GIS) specialists. It allows users to access individual data layer values, overlay relevant data sets, and zoom into segments of interest. The platform prototype is being developed specifically for Portsmouth Harbor and the Great Bay Estuary, NH. The prototype demonstrates the capabilities of an integrated data management platform and serves as the pilot for web-based GIS platforms in other regions. | |||||
BibTeX:
@inproceedings{jacobi2008,
  author = {Jacobi, M. and Kinner, N. E. and Braswell, B. and Schwehr, K. and Newman, K. S. and Merten, A. A.},
  title = {Environmental Response Management Application},
  booktitle = {Interational Oil Spill Conference},
  year = {2008},
  note = {http://vislab-ccom.unh.edu/~schwehr/papers/20080507-Jacobi-IOSC.pdf},
  url = {http://vislab-ccom.unh.edu/~schwehr/papers/20080507-Jacobi_IOSC_paper.pdf}
}
|
|||||
| Kurt D. Schwehr, Richard T. Brennan, J.S.S.S. | Discovery of Marine Datasets and Geospatial Metadata Visualizations | 2009 | Fall AGU | article | URL |
| Abstract: NOAA's National Geophysical Data Center (NGDC) provides the deep archive of US multibeam sonar hydrographic surveys. NOAA stores the data as Bathymetric Attributed Grids (BAG; http://www.opennavsurf.org/) that are HDF5 formatted files containing gridded bathymetry, gridded uncertainty, and XML metadata. While NGDC provides the deep store and a basic ERSI ArcIMS interface to the data, additional tools need to be created to increase the frequency with which researchers discover hydrographic surveys that might be beneficial for their research. Using Open Source tools, we have created a draft of a Google Earth visualization of NOAA's complete collection of BAG files as of March 2009. Each survey is represented as a bounding box, an optional preview image of the survey data, and a pop up placemark. The placemark contains a brief summary of the metadata and links to directly download of the BAG survey files and the complete metadata file. Each survey is time tagged so that users can search both in space and time for surveys that meet their needs. By creating this visualization, we aim to make the entire process of data discovery, validation of relevance, and download much more efficient for research scientists who may not be familiar with NOAA's hydrographic survey efforts or the BAG format. In the process of creating this demonstration, we have identified a number of improvements that can be made to the hydrographic survey process in order to make the results easier to use especially with respect to metadata generation. With the combination of the NGDC deep archiving infrastructure, a Google Earth virtual globe visualization, and GeoRSS feeds of updates, we hope to increase the utilization of these high-quality gridded bathymetry. This workflow applies equally well to LIDAR topography and bathymetry. Additionally, with proper referencing and geotagging in journal publications, we hope to close the loop and help the community create a true "Geospatial Scholar" infrastructure. |
|||||
BibTeX:
@article{schwehr2009c,
  author = {Kurt D. Schwehr, Richard T. Brennan, Jon Sellars, Shep Smith},
  title = {Discovery of Marine Datasets and Geospatial Metadata Visualizations},
  journal = {Fall AGU},
  year = {2009},
  url = {http://www.youtube.com/watch?v=erZu1tYNNR4}
}
|
|||||
| Kurt Schwehr, Paul Andres, J.C.R.D.E.D.J.N.F.Z.G.K.K.M.L.S.L.C.L.N.L.R.O.P.S.M.S.S.S. & the Phoenix Science Team | Visualizing the Operations of the Phoenix Mars Lander | 2008 | Fall AGU | conference | URL |
| Abstract: With the successful landing of the Phoenix Mars Lander comes the task of visualizing the spacecraft, its operations and surrounding environment. The JPL Solar System Visualization team has brought together a wide range of talents and software to provide a suit of visualizations that shed light on the operations of this visitor to another world. The core set of tools range from web-based production tracking (Image Products Release Website), to custom 3D transformation software, through to studio quality 2D and 3D video production. We will demonstrate several of the key technologies that bring together these visualizations. Putting the scientific results of Phoenix in context requires managing the classic powers-of-10 problem. Everything from the location of polar dust storms down to the Atomic Force Microscope must be brought together in a context that communicates to both the scientific and public audiences. We used Lightwave to blend 2D and 3D visualizations into a continuous series of zooms using both simulations and actual data. Beyond the high-powered industrial strength solutions, we have strived to bring as much power down to the average computer user's standard view of the computer: the web browser. Zooming and Interactive Mosaics (ZIM) tool is a JavaScript web tool for displaying high-resolution panoramas in a spacecraft-centric view. This tool allows the user to pan and zoom through the mosaic, indentifying feature and target names, all the while maintaining a contextual frame-of-reference. Google Earth presents the possibility of taking hyperlinked web browser interaction into the 3D geo-browser modality. Until Google releases a Mars mode to Google Earth, we are forced to wrap the Earth in a Mars texture. However, this can still provide a suitable background for exploring interactive visualizations. These models range over both regional and local scales, with the lander positioned on Mars and the local environment mapped into pseudo-"Street View" modes. Many visualizations succeed by altering the interaction metaphor. Therefore, we have attempted to completely overload the Google Earth interface from a traditional planetary globe into a mosaic viewer by mapping the Phoenix Mosaics onto the sphere and using geographic latitude and longitude coordinates as the camera pointing coordinates of a Phoenix mosaic. This presentation focuses on the data management and visualization aspects of the mission. For scientific results, please see the special section "U13 The Phoenix Mission." |
|||||
BibTeX:
@conference{schwehr2008c,
  author = {Kurt Schwehr, Paul Andres, Jason Craig, Robert Deen, Eric De Jong, Nick Fortino, Zareh Gorjian, Koji Kuramura, Mark Lemmon, Steve Levoe, Christopher Leung, Neil Lutz, Ryan Ollerenshaw, Peter Smith, Michael Stetson, Shigeru Suzuki, and the Phoenix Science Team},
  title = {Visualizing the Operations of the Phoenix Mars Lander},
  booktitle = {Fall AGU},
  year = {2008},
  url = {http://vislab-ccom.unh.edu/~schwehr/papers/2008-agu-phoenix-schwehr.png}
}
|
|||||
| Lee, P., Cassidy, W.A., Apostolopoulos, D., Deans, M., Foessel, A., Krause, C., Parra, J., Pedersen, L., Schwehr, K. & Whittaker, W.L. | Search for Meteorites in the Patriot Hills Area, Ellsworth Mountains, West Antarctica | 1998 | Meteoritics & Planetary Science, vol. 33, p. A92 Vol. 33, pp. 92 |
article | URL |
| Abstract: A (human) search for meteorites was conducted in the Patriot Hills area (80o20'S, 81o20'W), Ellsworth Mountains, West Antarctica, between 30 Dec, 1997 and 25 Jan, 1998 as a part of a site characterization study for the Robotic Antarcitc Metoeorite Search (RAMS) Project. The goal of the RAMS Project of the Robotics Institude of Carnegie Mellon University is to develop a robotic vehicle, the NOMAD rover, capable of searching for meteorites in Antarctica automounsly. The Patriot hills site was chosen because of its relative ease and economy of access and because of its established geologic diversity. A program of field tests of components and instruments to integrated onto NOMAD in late 1998 was carried out at the Patriot Hills during the 97-98 field season in conjunction with the search for meteorites reported here. | |||||
BibTeX:
@article{lee1998,
  author = {Lee, P. and Cassidy, W. A. and Apostolopoulos, D. and Deans, M. and Foessel, A. and Krause, C. and Parra, J. and Pedersen, L. and Schwehr, K. and Whittaker, W. L.},
  title = {Search for Meteorites in the Patriot Hills Area, Ellsworth Mountains, West Antarctica},
  journal = {Meteoritics & Planetary Science, vol. 33, p. A92},
  year = {1998},
  volume = {33},
  pages = {92},
  url = {http://vislab-ccom.unh.edu/~schwehr/papers/lee98-meteorites-antarctica.pdf}
}
|
|||||
| Mayer, L. & CCOM/JHC | 2006 UNH/NOAA Joint Hydrographic Center, Performance and Progress Report [BibTeX] |
2007 | techreport | URL | |
BibTeX:
@techreport{mayer2007,
  author = {Larry Mayer and CCOM/JHC},
  title = {2006 UNH/NOAA Joint Hydrographic Center, Performance and Progress Report},
  year = {2007},
  url = {http://vislab-ccom.unh.edu/~schwehr/papers/2006_ccom_pregressReport.pdf}
}
|
|||||
| Mayer, L. & the JHC | UNH/NOAA Joint Hydrographic Center, 2009 Performance and Progress Report | 2010 | techreport | URL | |
| Abstract: In 2009, Calder and Kurt Schwehr developed tools to automatically extract information necessary to inform the model from Automatic Information System (AIS) transmissions. They found many problems with the information contained in the AIS messages but after much filtering were able to extract needed informa- tion in a form appropriate for input into the model for a given vessel type entering and leaving the Port of Norfolk. Inherent in our data-processing phi- losophy is our long-held belief that the “products” of hydrographic data process- ing can also serve a variety of applications and constituencies well beyond hydrogra- phy. Another long-held tenet of the Cen- ter is that the standard navigation charts produced by the world’s hydrographic au- thorities do not do justice to the informa- tion content of high-resolution multibeam and sidescan-sonar data. We also believe that the mode of delivery of these prod- ucts will inevitably be electronic—and thus our initiation of “The Chart of the Future” project. This effort draws upon our visualization team, our signal and image processors, our hydrographers, and our mariners. In doing so, it epitomizes the strength of our Center—the ability to bring together talented people with a range of skills to focus on problems that are important to NOAA and the nation. The project has made important advances with the successful demonstration of the use of the Automatic Identifica- tion System combined with our visualization tools for display of warnings of the presence of acoustically de- tected Right Whales in shipping lanes into and out of Boston Harbor. As mentioned above, this project was cited by the White House Council on Environmental Quality as a prime example of Marine Spatial Planning. The ability of the AIS system to provide automated two-way communications with a vessel has opened up a world of possibilities in the context of safe navigation and other applications. Among the AIS-related projects we are working on are: 1- the use of AIS for Sanctuary |
|||||
BibTeX:
@techreport{mayer2010,
  author = {Mayer, L. and the JHC},
  title = {UNH/NOAA Joint Hydrographic Center, 2009 Performance and Progress Report},
  year = {2010},
  url = {http://ccom.unh.edu/about_us/reports/2009_ccom_progressReport.pdf}
}
|
|||||
| Mayer, L. & the JHC | 2008 UNH/NOAA Joint Hydrographic Center, Performance and Progress Report | 2009 | CCOM Reports | article | URL |
| Abstract: Inherent in our data processing philosophy is our long- held belief that the “products” of hydrographic data processing can also serve a variety of applications and constituencies well beyond hydrography. Another long- held tenet of the Center is that the standard navigation charts produced by the world’s hydrographic authorities do not do justice to the information content of high- resolution multibeam and sidescan sonar data. We also believe that the mode of delivery of these products will inevitably be electronic—and thus our initiation of “The Electronic Chart of the Future” project. This effort draws upon our visualization team, our signal and image processors, our hydrographers, and our mariners. In doing so, it epitomizes the strength of our Center—the ability to bring together talented people with a range of skills to focus on problems that are important to NOAA and the nation. The project has made important advances this year with the successful demonstration of the use of the Automatic Information System (AIS) combined with our visualization tools for display of warnings of the presence of acoustically detected right whales in shipping lanes into and out of Boston Har- bor. The ability of the AIS system to provide automated two-way communications with a vessel has opened up a world of possibilities in the context of safe navigation and other applications. Among the AIS-related projects we are working on are: 1- the use of AIS for Sanctuary management (we are working with the Stellwagen Na- tional Marine Sanctuary to track vessel types and traffic patterns through the sanctuary); 2- the use of AIS data for hydrographic survey planning, and; 3- approaches for using data from the Voluntary Observing Ship (VOS) of the World Meteorological Organization and NOAA’s Automated Mutual Assistance Vessel Rescue System (AMVERS) for long-range tracking of vessels. This may be extendable to a truly global system through the new USCG LEO satellite that has an AIS receiver on it. As a transitionary entry into the world of the ‘Chart of the Future,’ we have developed and released this year a fully digital and interactive version of the commonly used Coast Pilot books (GeoCoastPilot) for Portsmouth, NH. With such a digital product, the mariner can, in real-time, on the vessel or before entering a harbor, explore, through the click of a mouse, any object identified in the text and see a pictorial representation (in 2 or 3-D) of the object in geospatial context. Conversely a click on a picture of an object will link directly to the full descrip- tion of the object as well as other relevant information. GeoCoastPilot turns the NOAA Coast Pilot® into an interactive document linked to a 3D map environment, providing links between the written text, 2D and 3D views, web content, and other primary sources such as charts, maps, and related federal regulations. A critical component of this effort has been devising methods and tools to transform the current text of the Coast Pilot into an xml form that allows for integration with other kinds of data, especially geore- ferencing information. It is this aspect that has generated the greatest interest from both NOAA and the commercial sector. GeoCoast Pilot had its first release on June 6, 2008 with a presentation to the Ports- mouth Yacht Club. It is freely available on our website (there have been 227 down- loads thus far) and we have conducted phone interviews and web surveys with interested users. We are working on add- ing Boston Harbor to the system for 2009. |
|||||
BibTeX:
@article{mayer2009,
  author = {Mayer, L. and the JHC},
  title = {2008 UNH/NOAA Joint Hydrographic Center, Performance and Progress Report},
  journal = {CCOM Reports},
  year = {2009},
  url = {http://vislab-ccom.unh.edu/~schwehr/papers/2008_ccom_progressReport.pdf}
}
|
|||||
| Mayer, L. & the JHC | Performance and Progress Report for 2007, NOAA Ref No: NA0NOS4001153, Joint Hydrographic Center, 01/01/2007-12/31/2007 | 2008 | CCOM Reports | article | URL |
| Abstract: Inherent in the Navigation Surface concept is our long-held belief that the “products” of hydrographic data processing can also serve a variety of applications and constituencies well beyond hydrography. Another long-held tenet of the Center is that the standard navigation charts produced by the world’s hydrographic authorities do not do justice to the information content of high- resolution multibeam and sidescan sonar data. We also believe that the mode of delivery of these products will inevitably be electronic - and thus our initiation of “The Electronic Chart of the Future” project. This effort draws upon our visualization team, our signal and image processors, and our hydrographers and mariners. In doing so, it epitomizes the strength of our Center - the ability to bring together talented people with a range of skills to focus on problems that are important to NOAA and the nation. The project has taken roots this year with the successful demonstration of the use of the Automatic Information System (AIS) combined with our visualization tools for verification of compliance with changes in vessel traffic patterns designed to route vessels outside of a known whale migration route. This same capability was used by NOAA and the USCG to quickly view and evaluate the November 2007 collision of the containership Cosco-Buson with the San Francisco Bay Bridge. We have also introduced this year a prototype “Digital Coast Pilot” -- a fully digital and interactive version of the commonly used Coastal Pilot books. With the Digital Coast Pilot mariners can explore, through a mouse click, any object identified in the text and see a pictorial representation (in 2-D or 3-D) of the object in geospatial context. Conversely, a click on the picture of an object will link directly to the full description of the object well as other relevant information. |
|||||
BibTeX:
@article{mayer2008,
  author = {Mayer, L. and the JHC},
  title = {Performance and Progress Report for 2007, NOAA Ref No: NA0NOS4001153, Joint Hydrographic Center, 01/01/2007-12/31/2007},
  journal = {CCOM Reports},
  year = {2008},
  url = {http://vislab-ccom.unh.edu/~schwehr/papers/2007_ccom_progressReport.pdf}
}
|
|||||
| McGillivary, P.A., Curcio, J., Fall, K., Maffei, A., Schwehr, K., Kitts, C. & Twiggs, B. | Autonomous Surface Vessels for Ais-Sea Flux and Satellite Calibration / Validation Studies | 2006 | 1st Joint GOSUD/SAMOS Workshop | inproceedings | URL |
| Abstract: Why a self-positing buoy? - Eliminate cost, hassles of cable, swivels, weights, chain, etc. |
|||||
BibTeX:
@inproceedings{mcgillivary2006b,
  author = {McGillivary, P. A. and Curcio, Joseph and Fall, Kevin and Maffei, Andy and Schwehr, K. and Kitts, Chris and Twiggs, Bob},
  title = {Autonomous Surface Vessels for Ais-Sea Flux and Satellite Calibration / Validation Studies},
  booktitle = {1st Joint GOSUD/SAMOS Workshop},
  publisher = {Shipboard Automated Meteorilogical and Oceanographic System initiative and Global Ocean Surface Underway Data project},
  year = {2006},
  url = {http://vislab-ccom.unh.edu/~schwehr/papers/McGillivarySAMOSPMCG06.ppt}
}
|
|||||
| McGillivary, P., S.K.F.K. | Enhancing AIS to Improve Whale-Ship Collision Avoidance and Maritime Security | 2009 | MTS/IEEE | conference | URL |
| Abstract: Whale-ship strikes are of growing worldwide concern due to the steady growth of commercial shipping. Improving the current situation involves the creation of a communication capability allowing whale position information to be estimated and exchanged among vessels and other observation assets. An early example of such a system has been implemented for the shipping lane approaches to the harbor of Boston, Massachusetts where ship traffic transits areas of the Stellwagen Bank National Marine Sanctuary frequently used by whales. It uses the Automated Identification Systems (AIS) technology, currently required for larger vessels but becoming more common in all classes of vessels. However, we believe the default mode of AIS operation will be inadequate to meet the long-term needs of whale-ship collision avoidance, and will likewise fall short of meeting other current and future marine safety and security communication needs. This paper explores the emerging safety and security needs for vessel communications, and considers the consequences of a communication framework supporting asynchronous messaging that can be used to enhance the basic AIS capability. The options we analyze can be pursued within the AIS standardization process, or independently developed with attention to compatibility with existing AIS systems. Examples are discussed for minimizing ship interactions with Humpback Whales and endangered North Atlantic Right Whales on the east coast, and North Pacific Right Whales, Bowhead Whales, Humpback Whales, Blue Whales and Beluga Whales in west coast, Alaskan and Hawaiian waters. | |||||
BibTeX:
@conference{mcgillivary2009,
  author = {McGillivary, P., Schwehr, K., Fall, K},
  title = {Enhancing AIS to Improve Whale-Ship Collision Avoidance and Maritime Security},
  booktitle = {MTS/IEEE},
  year = {2009},
  note = {Schwehr presented},
  url = {http://vislab-ccom.unh.edu/~schwehr/papers/2009-mcgillivary-IEEEOceans-MTS.pdf}
}
|
|||||
| Michele Jacobi, Rob Braswell, A.M.N.K.K.S. | Environmental Response Management Application (ERMA) - Web-based GIS data display and management system for oil spill planning and environmental response | 2009 | Coastal Geotools | conference | URL |
| Abstract: NOAA's Office of Response and Restoration (ORR) in a partnership with the University of New Hampshire Coastal Response Research Center (CRRC), is leading an effort to develop an Open Source GIS system that is accessible to both the command post and to assets in the field during a response. The ERMA (Environmental Response Management Application) system is an integrated data management platform that uses MapServer and Open Layers software to combine real-time and static regional geospatial data sets. Data available include: weather and forecasts, ESI maps, IOOS buoys, modeled spill trajectories, real-time tracks of vessels, response plans, navigational charts, bathymetry, restoration projects, water quality and sediment chemistry data, protected and economically important areas, and other natural resource information. The application is able to upload, manipulate, analyze and display spatially referenced data for solving complex resource issues. The web-based nature of ERMA is critical as it allows for the integration and synthesis of various types of information, provides a common operational picture for all individuals involved in an incident, improves communication and coordination among responders and stakeholders, and provides resource managers with the information necessary to make faster and better informed decisions. In terms of pre-planning and preparedness for oil spill response, this system is nearly as important as any oil spill detection or response technique. The pilot site was developed for Portsmouth NH and now NOAA is partnering with other entities to develop an ERMA system for locations such as the Caribbean and Arctic. | |||||
BibTeX:
@conference{jacobi2009,
  author = {Michele Jacobi, Rob Braswell, Amy Merten, Nancy Kinner, Kurt Schwehr},
  title = {Environmental Response Management Application (ERMA) - Web-based GIS data display and management system for oil spill planning and environmental response},
  booktitle = {Coastal Geotools},
  year = {2009},
  url = {http://vislab-ccom.unh.edu/~schwehr/papers/2009-jacobi-geotools.txt}
}
|
|||||
| Miller, E.L., Gans, P.B. & the Stanford Geological Survey | Geologic Map of Wheeler Peak and Minerva Canyon 7.5' Quadrangles, White Pine County, Nevada, Unpublished | 1993 | techreport | URL | |
| Abstract: This study of the 7.5 minute Minerva Canyon and Wheeler Peak Quadrangles at 1:24,000 builds on Whitebread's (1969) mapping of the old 15 minute Wheeler Peak and Garrison Quadrangles at 1:48,000 and more closely examines the structural relationships and the timing of faulting in the region. Early Precambrian stratigraphic units exposed in the Wheeler Peak and Minerva Canyon Quadrangles (300 meters exposed thickness) are believed to represent a Windemeer-age rifting event (800-600 Ma) along the western margin of North America. Lower Cambrian terrigenous detrital sediments were likely associated with the main rifting event (approximately 550 Ma) and form the basal section of a miogeoclinal succession of conformable Paleozoic age carbonates and clastic sediments (15 kilometers thick). The major structural feature of the region, the Southern Snake Range decollement (SSRD), separates this stratified sequence into an upper plate of normal faulted and attenuated Cambrian and younger miogeoclinal sedimentary rocks and a relatively intact lower plate of Late Precambrian to Middle Cambrian strata that has been metamorphosed to amphibolite facies in the vicinity of Jurassic and Cretaceous plutons. Two cleavages previously correlated with temporally distinct pluton emplacements (at 155 +/- Ma and 79.1+/- 0.5 Ma) were measured and studied. These strike approximately north-northwest and dip to the east and west, respectively. Tertiary and Quaternary age rocks are represented in the map area by older alluvial fan conglomerates, extrusive volcanic rocks (the Tertiary Needles Range Formation dated at 33-27 Ma), younger conglomerates, and unconsolidated sediments. Four major normal fault systems are present in the upper plate of the SSRD, and one relatively minor system of westward-dipping normal faults cuts the lower plate rocks in the westernmost part of the area. These systems include (from oldest to youngest) the Johns Wash and westward-dipping lower plate range-front fault systems, the Murphy Wash system, the Decathon fault system (unclear age relationships with the above), and the post-QTol fault system (postdating Quaternary-Tertiary older alluvium). A range-bounding westward-dipping normal fault (post-dating the above fault systems) is inferred from the well-defined, north-south trending western range front as well as from bedding orientations that suggest normal drag that may be associated with motion on that fault. The relative timing of motion on the faults and their relationship to the Tertiary Needles Range Formation leads to the possible conclusion that motion on the Southern Snake Range decollement may have occurred both prior to as well as following the deposition of the Needles Range Formation ash flow tuff (27-33 Ma). Together with relations in adjacent quadrangles, relative and absolute time relations suggest older motion along the SSRD to the west and younger motion to the east. This represents a prolonged surface of movement. Basin and Range uplift related to faulting probably occurred in the 20-15 Ma interval based on apatite fission track data. Faults responsible for this uplift are the easternmost parts of the SSRD as mapped along the eastern flank of the Snake Range and the inferred west-dipping fault on the west side of the range. These two faults may be responsible for general domed or anticline geometry of rocks in the range. | |||||
BibTeX:
@techreport{miller1993,
  author = {Elizabeth L. Miller and Phillip B. Gans and the Stanford Geological Survey},
  title = {Geologic Map of Wheeler Peak and Minerva Canyon 7.5' Quadrangles, White Pine County, Nevada, Unpublished},
  year = {1993},
  note = {Members of the Stanford Geological Survey in 1993 included Jeffrey M. Amato, Kai S. Anderson, Jack W. Daniels, Pilar E. Garcia, Andrew D. Hansen, Brian Landau, Ezra M. Mauer, Natalie A. McCullough, Kurt D. Schwehr and Benjamin E. Surpless.},
  url = {http://vislab-ccom.unh.edu/~schwehr/papers/SSR-Open.File.DRAFT.html}
}
|
|||||
| Monahan, D., Schwehr, K., Wigley, R., Tinmouth, N., Goncalves, D., Jinidasa, P., Uddin, J. & Ito, K. | Gebco Visual Library, Proof of Concept | 2008 | GEBCO Annual Meeting | inproceedings | URL |
| Abstract: The GEBCO Visual Library is a conceptual model that could incorporate, in the broadest sense, all oceanographic and hydrographic research compiled from various sources and allows it to be geo-referenced in an easily accessible and familiar visual interface. Google Earth, a freely-available virtual globe, was chosen as the platform due to its user-friendliness to a global community of varying educational backgrounds. The objective is to provide the user with as much scientific information as possible for any chosen location within the global oceans. The initial conceptual model has concentrated on multibeam bathymetry only. Data is presented in the form of an image of the bathymetric data with figure caption, research publication reference, and abstract. Information is positioned using Google Earth "thumbtacks" displayed over the GEBCO world chart. These "thumbtacks" can be selected to provide pop-up windows, which display the embedded bathymetric image together with the other contents mentioned above. The GEBCO Visual Library is envisioned to be a resource that will facilitate the dissemination of oceanographic information amongst an interdisciplinary international community with diverse requirements. |
|||||
BibTeX:
@inproceedings{monahan2008a,
  author = {Monahan, D. and Schwehr, K. and Wigley, R. and Tinmouth, N. and Goncalves, D. and Jinidasa, P. and Uddin, J. and Ito, K.},
  title = {Gebco Visual Library, Proof of Concept},
  booktitle = {GEBCO Annual Meeting},
  publisher = {GEBCO},
  year = {2008},
  url = {http://vislab-ccom.unh.edu/~schwehr/papers/gebco-200805.png}
}
|
|||||
| Nguyen, L., Bualat, M., Edwards, L., Flueckiger, L., Neveu, C., Schwehr, K., Wagner, M.D. & Zbinden, E. | Virtual reality interfaces for visualization and control of remote vehicles | 2001 | Vol. 11Autonomous Robots, pp. 56-68 |
inproceedings | URL |
| Abstract: The Autonomy and Robotics Area (ARA) at NASA Ames Research Center has investigated the use of various types of Virtual Reality-based operator interfaces to remotely control complex robotic mechanisms. In this paper, we describe the major accomplishments and technology applications of the ARA in this area, and highlight the advantages and issues related to this technology. | |||||
BibTeX:
@inproceedings{nguyen2001,
  author = {Nguyen, L. and Bualat, M. and Edwards, L. and Flueckiger, L. and Neveu, C. and Schwehr, K. and Wagner, M. D. and Zbinden, E.},
  title = {Virtual reality interfaces for visualization and control of remote vehicles},
  booktitle = {Autonomous Robots},
  year = {2001},
  volume = {11},
  pages = {56-68},
  url = {http://vislab-ccom.unh.edu/~schwehr/papers/nguyen-etal-2001.pdf}
}
|
|||||
| Nguyen, L., Schwehr, K., Tucker, D., Zbinden, E., Derbes, A., Henning, P. & Vallidis, N. | The Viz Architecture | 1999 | techreport | URL | |
| Abstract: The Intelligent Mechanisms Group (IMG) at NASA Ames Research Center has built a series of Virtual Environments for Vehicle Interfaces (VEVI) for telerobotic control. Virtual environments provide a high-bandwidth feedback to the operator and allow an intuitive interaction with the remote robotic mechanism. In order to handle a tighter integration with a growing number of tools, while still maintaining the graphics performance necessary for a realistic telepresence, the IMG has built a visualization package called 'viz'. Viz is a 3D graphics rendering server, one of the modules of IMG's core architecture that allows distributed processing across machines on the same network. Clients such as the user interface, or telemetry display modules can connect to Viz via a socket connection and send messages, in order to modify the scene graph. Some examples of messages include 'add object', 'change color', 'move object', 'remove object'. Clients can be written in any language assuming the language supports socket communication and External Data Representation (XDR) encoding/decoding. Viz supports multi-connections of one or more clients. The server also provides sub-threads to process incoming messages, thus allowing the user to interact with the scene graph with minimal interruptions from communications. The 3D capabilities of Viz are based on the graphics library OpenInventor. | |||||
BibTeX:
@techreport{nguyen1999,
  author = {Nguyen, L. and Schwehr, K. and Tucker, D. and Zbinden, E. and Derbes, A. and Henning, P. and Vallidis, N.},
  title = {The Viz Architecture},
  year = {1999},
  url = {http://vislab-ccom.unh.edu/~schwehr/papers/nguyen1999-viz-unpub.txt}
}
|
|||||
| Nguyen, L., B.M.E.L.F.L.N.C.S.K.W.M.D.Z.E. | Virtual Reality Interfaces for Visualization and Control of Remote Vehicles | 2000 | IEEE International Conference on Robotics and Automation (ICRA) | article | URL |
| Abstract: The Autonomy and Robotics Area (ARA) at NASA Ames Research Center has investigated the use of various types of Virtual Reality-based operator interfaces to remotely control complex robotic mechanisms. In this paper, we describe the major accomplishments and technology applications of the ARA in this area, and highlight the advantages and issues related to this technology. | |||||
BibTeX:
@article{nguyen2000,
  author = {Nguyen, L., Bualat, M. Edwards, L., Flueckiger, L., Neveu, C., Schwehr, K, Wagner, M. D., Zbinden, E.},
  title = {Virtual Reality Interfaces for Visualization and Control of Remote Vehicles},
  journal = {IEEE International Conference on Robotics and Automation (ICRA)},
  year = {2000},
  url = {http://vislab-ccom.unh.edu/~schwehr/papers/2000-ICRA-VRforRobotControl.PDF}
}
|
|||||
| Plumlee M., Schwehr K., A.L.S.B.W.C. | GeoCoastPilot Better ways of organizing and displaying information in support of port familiarization | 2009 | MTS/IEEE | conference | URL |
| Abstract: GeoCoastPilot is a research software application built to explore techniques for simplifying access to the navigation information a mariner needs prior to entering or leaving a port. GeoCoastPilot is intended to demonstrate what is possible with current technology and to facilitate technology transfer. We started with the question, “What might a digital application based on the NOAA Coast Pilot look like if other marine data sources were combined with it?” Along these lines, GeoCoastPilot introduces two new capabilities to existing marine information products: multiramas and microlinks. These capabilities are intended to help the user develop a more complete and integrated mental model of a port before encountering it for the first time. Operational benefits of GeoCoastPilot include: •decreased time in searching for relevant information; •fewer errors in interpreting the information; and • increased awareness of important navigation aids, hazards, and regulations. In order for commercial software applications to more easily adopt multiramas and microlinking, we advocate two paradigms for data collection and management. First, pertinent marine information sources should be tagged with consistent feature-level metadata. Second, simple mappings of object and attribute names between different information sources should be published and maintained without necessarily being tied to the requirements of any one information source. |
|||||
BibTeX:
@conference{plumlee2009,
  author = {Plumlee M., Schwehr K., Alexander, L., Sullivan, B., Ware, C.},
  title = {GeoCoastPilot Better ways of organizing and displaying information in support of port familiarization},
  booktitle = {MTS/IEEE},
  year = {2009},
  note = {Presented by Schwehr. http://www.youtube.com/watch?v=FZqDNQouh7s},
  url = {http://vislab-ccom.unh.edu/~schwehr/papers/2009-plumlee-geocoastpilot.pdf}
}
|
|||||
| Plumlee, M., Schwehr, K., Sullivan, B. & Ware, C. | GeoCoastPilot - Linking the Coast Pilot with Geo-referenced Imagery & Chart Information | 2008 | Shallow Water, pp. 1 | inproceedings | URL |
| Abstract: DRAFT: When faced with the task of bringing a vessel to an unfamiliar port, the mariner typically relies on more than just a chart. Whether commercial or recreational, this consumer of marine information usually consults sources supplemental to the charts, such as a Coast Pilot or a cruising guide. Currently the NOAA Coast Pilot is a text document with a few images. It references prominent on-shore features but only provides precise geographic locations for a few of them. We have built a software prototype that uses hyperlinks to integrate Coast Pilot information with precisely geo-referenced imagery of shore features displayed in a 3D chart environment. GeoCoastPilot is a prototype application built on GeoZui4D that provides the mariner with an integrated 3D environment for exploring Portsmouth Harbor. GeoCoastPilot fuses information from Chapter 9 of NOAA Coast Pilot 1 with charts, S-57 data, images of landmarks, and high-resolution bathymetry for the area around Portsmouth Harbor. When the mariner clicks on a hyperlinked feature in the Coast Pilot text, the 3D view is brought to the image and/or location of feature and any related S-57 data is displayed. If an image or S-57 object is clicked, associated Coast Pilot text is highlighted and any additional related S-57 data is displayed. In addition, links to federal regulations (CFRs) in the Coast Pilot text bring up the full text of the referenced regulations. GeoCoastPilot serves as an example of what is likely to evolve in commercial products, and highlights the challenges that must be overcome to provide the mariner what they will ultimately be looking for. XML is the active ingredient to GeoCoastPilot that gives it the ability to fuse disparate data sources together. Once items in the original Coast Pilot text are identified, the text can be marked up with XML tags identifying these items as key shore features, regulations, or attributes of interest. These tags can then be mapped to information in other sources through various attributes: to S-57 information by name; to raster charts and bathymetry by geographic position; to photographic imagery by feature name; to federal regulation by title and section. The potential also exists to map the tagged information to online resources, including tide and current tables, websites of facilities of interest on- or near-shore, or sites of interest agreed upon by communities of like-minded consumers. This presentation will give a demonstration of GeoCoastPilot and its main features, and will briefly mention some implications that similar applications may eventually have on near-shore mapping operations and marine information systems. |
|||||
BibTeX:
@inproceedings{plumlee2008a,
  author = {Plumlee, Matthew and Schwehr, Kurt and Sullivan, Briana and Ware, Colin},
  title = {GeoCoastPilot - Linking the Coast Pilot with Geo-referenced Imagery & Chart Information},
  booktitle = {Shallow Water},
  publisher = {CCOM},
  year = {2008},
  pages = {1},
  url = {http://vislab-ccom.unh.edu/~schwehr/papers/2008plumlee-shallow-survey.doc}
}
|
|||||
| Schwehr, K, P.M.S.B.W.C. | GeoCoastPilot: Linking the Coast Pilot with Geo-referenced Imagery & Chart Information | 2009 | IHO Standardization of Nautical Publications Working Group (SNPWG) | conference | URL |
| Abstract: CCOM and the VisLab have created the GeoCoastPilot to demonstrate and test a number of concepts. The key focus has been to increase the amount of georeferencing that goes along with any feature or area in the nautical publication. Think of this as geospatial hyperlinks as you might find on an internet web page. Anything in the text that is a place should be a clickable link to the location in a view of the world or chart. Anything in the chart that has a reference in the text should be linkable back to the text. Additionally, any feature or location that has additional information in other charts or tables, should be able to have that information brought into the interface when that feature is selected by the operator (e.g. light lists and S57 object information). We believe that there are many different ways that this information could be linked, but by providing an instance of one particular display style, we aim to give the community something from which to spark discussion and debate within the community as to what might be possible. For example, here we have a 3D application, but what might need to change if the interface was purely 2D with only a map view? |
|||||
BibTeX:
@conference{schwehr2009b,
  author = {Schwehr, K, Plumlee, M., Sullivan, B., Ware, C.},
  title = {GeoCoastPilot: Linking the Coast Pilot with Geo-referenced Imagery & Chart Information},
  booktitle = {IHO Standardization of Nautical Publications Working Group (SNPWG)},
  year = {2009},
  url = {http://vislab-ccom.unh.edu/~schwehr/papers/20090226-SNPWG-Schwehr.pdf}
}
|
|||||
| Schwehr, K. | Exploring the Surface of Mars: Autonomy and Mobility for Planetary Geology | 2003 | CalSpace Seminar Series | inproceedings | |
| Abstract: will discuss the science goals of planetary rovers and how NASA and CMU have been working over the last ten years to design rover systems that are able to meet these science goals. I will cover a variety of rover field trials and how each has impacted the design of software systems used for rover control and interaction. Rover systems covered will include Marsokhod, Rocky 7, CMU’s Nomad, FIDO, Pathfinder/Sojourner, DS-1, and Mars Polar Lander. Software systems covered will include Viz, computer vision, Morphin, Arbiter, D*, and CLARAty. | |||||
BibTeX:
@inproceedings{schwehr2003e,
  author = {Schwehr, K.},
  title = {Exploring the Surface of Mars: Autonomy and Mobility for Planetary Geology},
  booktitle = {CalSpace Seminar Series},
  publisher = {CalSpace},
  year = {2003}
}
|
|||||
| Schwehr, K. | IALA AIS Binary Message Register 0.1 [BibTeX] |
2008 | RTCM SC121 AIS Binary Messages for VTS | inproceedings | |
BibTeX:
@inproceedings{schwehr2008b,
  author = {Schwehr, K.},
  title = {IALA AIS Binary Message Register 0.1},
  booktitle = {RTCM SC121 AIS Binary Messages for VTS},
  publisher = {RTCM},
  year = {2008}
}
|
|||||
| Schwehr, K. | Kurt's Weblog, Electronic Work Log | 2011 | Vol. 2008(31 Dec 2008) |
misc | URL |
| Abstract: Over 2000 posts about Marine Geology, Geospatial Technology, AIS, Spacecraft, and many other topics | |||||
BibTeX:
@misc{schwehr,
  author = {Schwehr, K.},
  title = {Kurt's Weblog, Electronic Work Log},
  year = {2011},
  volume = {2008},
  number = {31 Dec 2008},
  note = {Feel free to cite any particular post in my blog},
  url = {http://schwehr.org/blog}
}
|
|||||
| Schwehr, K. | noaadata-py | 2010 | misc | URL | |
| Abstract: noaadata-py is a suite of python tools for data used by or produced by NOAA. As of May 2007, the package contains code for marine Automatic Identification System (AIS) messages, extensions for the National AIS (N-AIS) network, and CO-OPS/PORTS waterlevel OpenDAP/SOAP. | |||||
BibTeX:
@misc{noaadata-py,
  author = {Schwehr, K.},
  title = {noaadata-py},
  year = {2010},
  url = {http://vislab-ccom.unh.edu/~schwehr/software/noaadata/}
}
|
|||||
| Schwehr, K. | Interplanetary Observation: Mars Rover Platform, Sensors and Applications [BibTeX] |
2010 | 2010 Ocean Observing: Thinking Outside the Basin, MTS TechSurge | article | |
BibTeX:
@article{schwehr2010a,
  author = {Schwehr, K.},
  title = {Interplanetary Observation: Mars Rover Platform, Sensors and Applications},
  journal = {2010 Ocean Observing: Thinking Outside the Basin, MTS TechSurge},
  year = {2010},
  note = {Invited talk}
}
|
|||||
| Schwehr, K. | Environmental Response Management Application (ERMA): From Portsmouth Response to NOAA’s GeoPlatform Gulf Response | 2010 | techreport | URL | |
| Abstract: In 2007, a small UNH team put together a prototype emergency response web application using open source tools on a Mac Desktop and later a Mac Mini. That system, called Portsmouth Response, was designed to assist in the first hours of an environmental incident by providing easy access to basic GIS layers without requiring GIS experts. This system generalized and renamed to ERMA, begin deployed as prototypes in the Caribbean and participating in the Spill Of National Significance (SONS) drill in New England during March 2010. Before the team could evaluate the performance during the SONS drill, the Deepwater Horizon platform exploded in the Gulf of Mexico on April 20, 2010. Four days later, the ERMA team was called in for 24x7 support of NOAA and USCG operations to handle the incident. ERMA went from prototype system to being the system providing the Common Operational Picture (COP) is just a few weeks. In early June, NOAA setup a system to mirror the unrestricted datasets for the public on the GeoPlatform system. Kurt describes how ERMA is designed and how it was used during the Deepwater Horizon oil spill incident. | |||||
BibTeX:
@techreport{schwehr2010c,
author = {Kurt Schwehr},
title = {Environmental Response Management Application (ERMA): From Portsmouth Response to NOAA’s GeoPlatform Gulf Response},
year = {2010},
url = {http://vislab-ccom.unh.edu/~schwehr/papers/201009-schwehr-erma-ccom-seminar.pptx}
}
|
|||||
| Schwehr, K. | Google's Spatial Tools in the Marine Environment - Decision Support | 2008 | Google Tech Talk | conference | URL |
| Abstract: Google Maps and Google Earth have put much of the functionality of Geographic Information Systems in the hands of the end users. Maritime users are just beginning to understand the power of map mashups that bring together diverse datasets to help mariners and those who manage the waterways to better understand the uses, risks, and impacts of vessel traffic on our nation's waterways. I will present a number of data types ranging from raster images of ocean flow modeling, to vessel traffic over time captured by the marine Automatic Identification System, to real time right whale notices for vessels approaching Boston Harbor. | |||||
BibTeX:
@conference{schwehr2008,
  author = {Kurt Schwehr},
  title = {Google's Spatial Tools in the Marine Environment - Decision Support},
  booktitle = {Google Tech Talk},
  year = {2008},
  url = {http://www.youtube.com/watch?v=Szw2mkqicos}
}
|
|||||
| Schwehr, K. | seismic-py: Reading seismic data with Python | 2008 | Python Papers Vol. 3(2), pp. 8 |
article | URL |
| Abstract: The field of seismic exploration of the Earth has changed dramatically over the last half a century. The Society of Exploration Geophysicists (SEG) has worked to create standards to store the vast amounts of seismic data in a way that will be portable across computer architectures. However, it has been impossible to predict the needs of the immense range of seismic data acquisition systems. As a result, vendors have had to bend the rules to accommodate the needs of new instruments and experiment types. For low level access to seismic data, there is need for a standard open source library to allow access to a wide range of vendor data files that can handle all of the variations. A new seismic software package, seismic-py, provides an infrastructure for creating and managing drivers for each particular format. Drivers can be derived from one of the known formats and altered to handle any slight variations. Alternatively drivers can be developed from scratch for formats that are very different from any previously defined format. Python has been the key to making driver development easy and efficient to implement. The goal of seismic-py is to be the base system that will power a wide range of experimentation with seismic data and at the same time provide clear documentation for the historical record of seismic data formats. | |||||
BibTeX:
@article{schwehr2008a,
  author = {Schwehr, K.},
  title = {seismic-py: Reading seismic data with Python},
  journal = {Python Papers},
  year = {2008},
  volume = {3},
  number = {2},
  pages = {8},
  url = {http://vislab-ccom.unh.edu/~schwehr/papers/schwehr2008-pythonpapers-seismic-py.pdf}
}
|
|||||
| Schwehr, K. | density | 2007 | misc | URL | |
| Abstract: Tools for working with SimVoleon vol format voxel data This project is a set of tools that I am using for my PhD thesis on comparing magnetic eigen parameters of sediments. That being said, other that the statistical bootstrap/error modeling code, the rest of the code is applicable to just about any volumetric project. I tend to think of the vol data structure as a 3D histogram. For each XYZ point, that adds to the count in any one cell. Remember that histograms have all kinds of sampling theory problems, so use volume data with care. |
|||||
BibTeX:
@misc{density,
  author = {Schwehr, K.},
  title = {density},
  publisher = {web},
  year = {2007},
  url = {http://vislab-ccom.unh.edu/~schwehr/software/density/}
}
|
|||||
| Schwehr, K. | AIS Binary Messages, Domain Examples and A case for a XML message definition language | 2007 | RTCM SC121 Working Group on Expanded Use of AIS with VTS Vol. 15-Nov-2007, pp. 47 |
article | URL |
| Abstract: Describes the motivations for AIS Binary messages for tides, zone messages, and other data to be sent over the AIS VHF channel. It also describes the XML format that can define the binary layout of the AIS message payload. | |||||
BibTeX:
@article{schwehr2007f,
  author = {Schwehr, K.},
  title = {AIS Binary Messages, Domain Examples and A case for a XML message definition language},
  journal = {RTCM SC121 Working Group on Expanded Use of AIS with VTS},
  year = {2007},
  volume = {15-Nov-2007},
  pages = {47},
  url = {http://vislab-ccom.unh.edu/~schwehr/papers/schwehr2007-rtcm-220-2007-SC121-013.pdf}
}
|
|||||
| Schwehr, K. | Google Earth Visualizations: Preview and Delivery of Hydrographic and Other Marine Datasets | 2007 | techreport | URL | |
| Abstract: Abstract Existing hydrographic data analysis and visualization tools are very powerful, but lack easy access to web data management tools. Virtual globe software provides a gateway to a host of important data products in formats usable by specialized tools such as CARIS, Fledermaus, and ArcGIS. With virtual globe interfaces, users see complimentary and consistent geographic representations of available data in an easy-to-navigate format. This paper presents a preview of visualizations that build upon virtual globe software. These examples are viewed in Google Earth, but could also be implemented in a number of alternative programs (e.g. NASA World Wind, Dapple, OSSIM Planet). Three datasets are assembled here as Google Earth visualizations to illustrate each of the four primary types of data (point, line, area, and time data). The USCG Marine Information for Safety and Law Enforcement (MISLE) database of ship incidents illustrates point data. A small sample of the USCG National Automatic Identification System logs (N-AIS) demonstrates rendering line and time-varying data. Area data is exmplified in the MBARI multibeam bathymetry of the Santa Barbara Basin. S57 chart objects are combined to demonstrate point, line and area data. The visualizations for our initial work were created with hand coding and small scripts. However, tools such as Fledermaus and RockWare have added Google Earth export functionality that makes authoring Google Earth resources easy to construct. For large datasets that require additional processing and analyses, Google Earth pop-up windows can include a range of download formats and list appropriate software to use. This virtual globe-based approach can make geospatial datasets more widely accessible via the World Wide Web. |
|||||
BibTeX:
@techreport{schwehr2007zFIX,
  author = {Schwehr, K},
  title = {Google Earth Visualizations: Preview and Delivery of Hydrographic and Other Marine Datasets},
  year = {2007},
  url = {http://vislab-ccom.unh.edu/~schwehr/papers/schwehr2007Apr13-ge-unpublished.pdf}
}
|
|||||
| Schwehr, K. | genargs-py | 2006 | misc | URL | |
| Abstract: Kurt's attempt to make command line arguments work well across gengetopts, C++ classes, and python with the option to use this for GUI's. | |||||
BibTeX:
@misc{genargs-py,
  author = {Schwehr, K.},
  title = {genargs-py},
  year = {2006},
  url = {http://vislab-ccom.unh.edu/~schwehr/software/genargs-py/}
}
|
|||||
| Schwehr, K. | Paleomagnetic and Statigraphic Techniques for Identifying Sediment Processes on Continental Margins | 2006 | School: University of California, San Diego | phdthesis | URL |
| Abstract: Understanding the origin of stratigraphic and morphologic features, whether they are formed by primary deposition or are the consequence of post-depositional alteration, is the critical first step to determining the history and evolution of continental margins. I have developed a new approach that when combined with prior geological and geophysical data, provides new constraints on the origin of stratigraphic sequences. This approach can detect high water content that could evolve into overpressure. Such zones have the potential to develop into slope failures. In addition, this approach can determine if morphologic features observed on many continental margins are current-controlled bedforms or retrogressive slides. The method combines anisotropy of magnetic susceptibility (AMS) with CHIRP seismic data, which provides new insights into the processes responsible for strata formation. First, I explore the limb of a slump in the Ardath Shale in the cliffs of La Jolla, CA. Laterally adjacent to the observed slump, AMS is able to identify a ``crypto-slump'' that is not directly identifiable in outcrop. Next, a study of the Santa Barbara basin explores the rapid deposition and deformation occurring on the northern slope, where AMS combined with other rock magnetic techniques distinguished diagenesis from zones of excess water and overconsolidation. Finally, I use the AMS approach to address the controversy regarding the formation of the Humboldt Slide. Based on morphology observed in CHIRP seismic data and the AMS signature of collocated piston cores, the Humboldt Slide is composed of a series of sediment waves, not a thin skinned deformation feature. | |||||
BibTeX:
@phdthesis{schwehr2006b,
  author = {Schwehr, K.},
  title = {Paleomagnetic and Statigraphic Techniques for Identifying Sediment Processes on Continental Margins},
  school = {University of California, San Diego},
  year = {2006},
  url = {http://vislab-ccom.unh.edu/~schwehr/papers/schwehr-thesis-UCSD-accepted.pdf}
}
|
|||||
| Schwehr, K. | seismic-py | 2006 | misc | URL | |
| Abstract: This is a python package to ready seismic data in the SEGY data format. It was started in May 2005 by Kurt Schwehr as segy-py. The name was changed to avoid a class with another package. | |||||
BibTeX:
@misc{seismic-py,
  author = {Schwehr, K.},
  title = {seismic-py},
  year = {2006},
  note = {Formerly known as segy-py, but there was a name class},
  url = {http://vislab-ccom.unh.edu/~schwehr/software/seismic-py/}
}
|
|||||
| Schwehr, K. | slogcxx | 2006 | misc | URL | |
| Abstract: A small C++ logging class by Kurt Schwehr. Provides a "<<" type interface so that it fields somewhat like iostreams. | |||||
BibTeX:
@misc{slogcxx,
  author = {Schwehr, K.},
  title = {slogcxx},
  year = {2006},
  url = {http://vislab-ccom.unh.edu/~schwehr/software/slogcxx/}
}
|
|||||
| Schwehr, K. | terrain | 2005 | Software | misc | URL |
| Abstract: Convert gridded file formats | |||||
BibTeX:
@misc{terrain,
  author = {Schwehr, K.},
  title = {terrain},
  year = {2005},
  url = {http://vislab-ccom.unh.edu/~schwehr/software/terrain/}
}
|
|||||
| Schwehr, K. | Visualizations of magnetic anisotropy: How to stop worrying and love the blob | 2004 | techreport | URL | |
| Abstract: This presentation will guide you through the background and application of Anisotropy of Magnetic Susceptibility 3D probability density estimations to marine slope failures. | |||||
BibTeX:
@techreport{schwehr2004b,
  author = {Kurt Schwehr},
  title = {Visualizations of magnetic anisotropy: How to stop worrying and love the blob},
  year = {2004},
  note = {This was my entry into the 2004 visualization contest},
  url = {http://vislab-ccom.unh.edu/~schwehr/Viz04/pop1.shtml}
}
|
|||||
| Schwehr, K. | SIO Visualization Class | 2003 | techreport | URL | |
| Abstract: The goal of this class is to teach the basic tools for building scientific visualizations of marine data. It will focus on using Mac OS X and SGI workstations. The SGI only sections are no longer relevant, however, OpenInventor lives on. | |||||
BibTeX:
@techreport{schwehr2003kFIX,
  author = {Schwehr, K},
  title = {SIO Visualization Class},
  year = {2003},
  url = {http://vislab-ccom.unh.edu/~schwehr/Classes/2003/VizClass03/}
}
|
|||||
| Schwehr, K. | Revision Control using CVS (Concurrent Version System) | 2003 | techreport | URL | |
| Abstract: This document will try to guide you through the basics of using CVS. It will use the GDC systems as a starting point. You don't need to know too much to get started using cvs, but you can learn endless amounts more as you become more experienced with it. 2010 Note: I now recommend strongly against using CVS. Use git, mercurial, or svn for most tasks. Occasionally RCS may still be the right tool for individual files. |
|||||
BibTeX:
@techreport{schwehr2003x,
  author = {Schwehr, K},
  title = {Revision Control using CVS (Concurrent Version System)},
  year = {2003},
  url = {http://vislab-ccom.unh.edu/~schwehr/papers/cvstutorial-1.2.txt}
}
|
|||||
| Schwehr, K. | Vis02 - XCore renderings of the Humboldt Slide | 2002 | techreport | URL | |
| Abstract: FIX: write this up! | |||||
BibTeX:
@techreport{schwehr2002,
  author = {Schwehr, K},
  title = {Vis02 - XCore renderings of the Humboldt Slide},
  year = {2002},
  url = {http://vislab-ccom.unh.edu/~schwehr/viz02/}
}
|
|||||
| Schwehr, K. | Martian Igneous Processes based on Mars Pathfinder Lander and Sojourner Rover, Unpublished | 2000 | techreport | URL | |
| Abstract: Before Mars Pathfinder, the only information gathered on the surface of Mars was from the Viking 1 and 2 landers (Binder 1977, Mutch 1977, Clark 1977, Toulmin 1977). Pathfinder landed July 4, 1997 in the Vallis Ares region of Mars (Golombek 1997). After landing, the site was named the Sagan Memorial Station (Figure 1). The lander is located at 19.13N, 33.22W in the USGS reference frame and 19.28N, 33.52W in inertial space from spacecraft tracking (Golombek 1999) (Figure 2). Viking 1 landed relatively close by on July 20, 1976 in the Western Part of Chryse Planitia at 22.5N, 48.0W USGS. Viking 2 landed farther away on August 7, 1976 at 44N, 226W USGS (Carr 1981). Mars Pathfinder was primarily to be a demonstration of entry, descent and landing systems. As such, engineering, not science, was the primary mission. The criteria for mission success were to return just one initial panorama from the landing site. The Pathfinder site was chosen to be a grab bag of samples in a safe landing area. To try to achieve a wide variety of rocks, the team chose a large outflow channel from a catastrophic flood (Britt 1998). The resulting landing site does indeed look like a flood plane and has 16% of the surface area covered in rocks. The Pathfinder Mission lasted 3 months until NASA's Deep Space Network (DSN) lost contact with the lander. The lander returned 2.3 giga bits of data, which contained 16500 lander and 550 rover images. The rover, Sojourner, managed to traverse 100m clockwise around the lander collecting 5 rock and 6 soil samples with the Alpha Proton x-ray Spectrometer (APXS) (Figure 3). The rover transmitted all data to Pathfinder for a relay back to Earth. Once the lander failed, the rover was also effectively at the end of its mission. |
|||||
BibTeX:
@techreport{schwehr2000,
  author = {Kurt Schwehr},
  title = {Martian Igneous Processes based on Mars Pathfinder Lander and Sojourner Rover, Unpublished},
  year = {2000},
  url = {http://vislab-ccom.unh.edu/~schwehr/papers/MarsPaper-IgnPet-2000.pdf}
}
|
|||||
| Schwehr, K. | Autonomous navigation for Mars Rovers | 1999 | MBARI Seminar | inproceedings | URL |
| Abstract: The communications capability of planetary exploration vehicles is commonly constrained due to long transmission distances, limited communication windows, and restricted power usage. To effectively utilize robotic exploration, algorithms for autonomous navigation and data collection must be developed. At Carnegie Mellon University, the Field Robotics Center has developed an integrated autonomous navigation system to support autonomous planetary robotic investigation techniques currently under development at other institutions. The system integrates dead-reckoning, inertial navigation, and stereoscopic vision using the fast local obstacle-avoidance algorithm, Morphin, and the global dynamic-path- planning algorithm, DStar. The two algorithms work together using the Arbiter algorithm developed by the National Robotics Engineering Consortium. The system was developed on an RWI ATRV-2 rover and will be tested this fall on the NASA/JPL 2005 Mars Rover prototype Fido/Rocky 8. The system is designed to run on a computer with the equivalent compute power and memory of a Pentium 133 with 32 Megabytes of RAM, a computer that is suitable for Martian deployment. |
|||||
BibTeX:
@inproceedings{schwehr1999,
  author = {Schwehr, K.},
  title = {Autonomous navigation for Mars Rovers},
  booktitle = {MBARI Seminar},
  year = {1999},
  url = {http://www.mbari.org/seminars/1999/sep03_schwehr.html}
}
|
|||||
| Schwehr, K. | Stereo Processing for the Mars Polar Lander, MVACS Image Pipeline / James Pipeline | 1999 | techreport | URL | |
| Abstract: This technical document describes the working of the bash scripts that drove the processing of image pairs from raw space craft images (Experimental Data Report [EDR]) into a wide variety of data products. This was the first mission where the team was able to automate the entire process from spacecraft downlink to 3D models in the press area, images on the web, and usable data products to the science teams. The JAMES pipeline was the inspiration for the bash script that drove the Mars Exploration Rovers. | |||||
BibTeX:
@techreport{schwehr1999a,
  author = {Kurt Schwehr},
  title = {Stereo Processing for the Mars Polar Lander, MVACS Image Pipeline / James Pipeline},
  year = {1999},
  url = {http://vislab-ccom.unh.edu/~schwehr/papers/MarsPolarLander/doc/james.txt}
}
|
|||||
| Schwehr, K. | VEVI and the Stereo Pipeline for Terrain Visualization | 1997 | Vol. XXVIIILunar and Planetary Science Conference |
inproceedings | |
| Abstract: Took an SGI Indigo2 to the conference at last minute request from Mike Sims | |||||
BibTeX:
@inproceedings{schwehr1997,
  author = {Schwehr, K.},
  title = {VEVI and the Stereo Pipeline for Terrain Visualization},
  booktitle = {Lunar and Planetary Science Conference},
  year = {1997},
  volume = {XXVIII}
}
|
|||||
| Schwehr, K. | ROV Telepresence Software | 1992 | techreport | URL | |
| Abstract: The NASA Ames ROV telepresence software adds head tracking, data logging, and navigation to the EXP512 software developed by Deep Ocean Engineering. In addition to the primary features, control of the Cohu camera's zoom and focus was developed, but not used do to damage of the camera. The software has been designed to give priority to head tracking, resulting in a 10 to 15 Hz update rate for the slaved camera. This rate was fast enough that the camera moters were responsible for almost all of the observer delay of pan and tilt. The science data is stored on disk in an ASCII file without interupting head tracking. The navigation system is bsaed on sighting oon navigation beacons - lights placed under the ice. The system is based on an Amiga 2000 equipped with a 7 port serial board and an Elchen anoalog to digital sampling board. | |||||
BibTeX:
@techreport{schwehr1992,
  author = {Schwehr, K.},
  title = {ROV Telepresence Software},
  year = {1992},
  note = {Work done for Carol Stoker. This document needs help and is missing portions.},
  url = {http://vislab-ccom.unh.edu/~schwehr/papers/schwehr1992-TROV-software.html}
}
|
|||||
| Schwehr, K. | Analysis of Photometric Data from a Robotic Telescope, Planet Search 1991, Using a Robotic Photometric Telescope to Search for Extrasolar Planets | 1991 | NASA Ames Contractor Report | article | URL |
| Abstract: These programs were written to analyze robotic telescope data from the Fairborn Observatory in Arizona. The programs were developed for William J. Borucki at NASA Ames Research Center by Bob Hogan and Kurt D. Schwehr. Bob Hogan wrote FIT and TAB. Kurt D. Schwehr wrote PLOT-NIT, PLOT-CLR, and PERIOD. This manual was written by Kurt D. Schwehr, except for section 2.0 FIT. The process of data analysis is taken car of by five programs. The data is transferred from the observatory's computer every couple of days. Each ATIS file contains data for one night and is compressed into an archive (ARC). Once the files are on the local computer, the program FIT does some initial data reduction and creates a very large binary data file. The program TAB is used to extract data for each star. The data is stored in ASCII tables that can be inspected, graphed and analyzed. PLOT-NIT and PLOT-CLR will plot up the data for viewing and printing. Finally, PERIOD is used to determine if any of the stars observed are likely to be variable. The next sections describe each of the five programs. |
|||||
BibTeX:
@article{schwehr1991,
  author = {Schwehr, K.},
  title = {Analysis of Photometric Data from a Robotic Telescope, Planet Search 1991, Using a Robotic Photometric Telescope to Search for Extrasolar Planets},
  journal = {NASA Ames Contractor Report},
  year = {1991},
  url = {http://vislab-ccom.unh.edu/~schwehr/papers/PlanetSearch1991/PlanetSearch1991.txt}
}
|
|||||
| Schwehr, K. | Acquire: Photometric Telescope Data Collection Software [BibTeX] |
1990 | techreport | URL | |
BibTeX:
@techreport{schwehr1990a,
  author = {Schwehr, K.},
  title = {Acquire: Photometric Telescope Data Collection Software},
  year = {1990},
  note = {Work done for William (Bill) Borucki},
  url = {http://vislab-ccom.unh.edu/~schwehr/papers/schwehr1990-acquire-telescope.txt}
}
|
|||||
| Schwehr, K. | Martian Dust Issues: Triboluminescence and Composition [BibTeX] |
1990 | NASA Ames Contractor Report | article | URL |
BibTeX:
@article{schwehr1990b,
  author = {Schwehr, K.},
  title = {Martian Dust Issues: Triboluminescence and Composition},
  journal = {NASA Ames Contractor Report},
  year = {1990},
  url = {http://vislab-ccom.unh.edu/~schwehr/papers/schwehr1990-mars-dust-NASA-ARC.html}
}
|
|||||
| Schwehr, K. & Alexander, L. | Specification Format for AIS Binary Messages for Providing Hydrographic-related Information | 2007 | US Hydro | inproceedings | URL |
| Abstract: UNH is working with the USCG and NOAA to use XML (Extensible Markup Language) to define binary messages for maritime-based AIS (Automatic Identification System). The draft specification format will enable hydrographic and maritime safety agencies to define message contents by providing a bit level description in XML (informally the "AIS Binary Message Decoder Ring"). This format improves the clarity of message specifications aiding both people defining the messages and software engineers implementing maritime systems. The XML file specifies of the order, length, and type of fields following a subset of that used by the ITU-R.M.1371-1. To reduce issues with accidents and errors caused by miscommunication (e.g., the Mars Climate Orbiter loss in 1999), units are declared for the numerical values, along with the standard descriptions and notes. The specification is independent of programming language (e.g., can be implemented in C, C++, C sharp, Java, Python, etc.) to allow vendors to integrate the system into their individual design requirements. Along with the XML specification, the draft specification contains a reference implementation of an AIS XML to Python compiler written in Python that has been released as open source under the GNU General Public License (GPL) version 2. A XML schema and an additional program will provide validation of the XML message definitions. A XSLT style sheet produces reference documentation in 'html' format. Although the XML message definition file specifies the order, size, and type of the bit stream, it does not specify semantics or how binary messages should be presented on an ECDIS or other display device. A demonstration of this specification for sending tide/water level messages will be part of the Elizabeth River Demonstration Project at the US HYDRO 2007. | |||||
BibTeX:
@inproceedings{schwehr2007c,
  author = {Schwehr, Kurt and Alexander, Lee},
  title = {Specification Format for AIS Binary Messages for Providing Hydrographic-related Information},
  booktitle = {US Hydro},
  year = {2007},
  note = {http://vislab-ccom.unh.edu/~schwehr/papers/schwehr2007-ushydro-ais.pdf},
  url = {http://vislab-ccom.unh.edu/~schwehr/papers/2007-schwehr-ushydro-ais.png}
}
|
|||||
| Schwehr, K. & Alexander, L. | Right whale AIS Project (RAP): Acoustic detections in the Boston Approaches [BibTeX] |
2009 | Inland Navigation Technology | conference | |
BibTeX:
@conference{schwehr2009a,
  author = {Schwehr, K and Alexander, L.},
  title = {Right whale AIS Project (RAP): Acoustic detections in the Boston Approaches},
  booktitle = {Inland Navigation Technology},
  year = {2009}
}
|
|||||
| Schwehr, K. & Alexander, L. | Encoding AIS Binary Messages in XML Format for Providing Hydrographic-related Information | 2007 | Internation Hydrographic Review Vol. 8(2), pp. 37-57 |
article | URL |
| Abstract: A specification is proposed to enable hydrographic and maritime safety agencies to encode AIS messages using Extensible Markup Language (XML). it specifies the order, length, and type of fields contained in ITU-R.M.1371-1. A XML schema validates the message definitions, and a XSLT style sheet produces reference documentation in 'html' format. AIS binary messages in XML are effective means to communicate dynamic and real-time port/waterway information. For example, tidal information can be continuously broadcast to maritime users and applied to a "tide-aware" ENC. The XML format aligns with the type of data encapsulation for the IHO Geospatial Standard for Digital Hydrographic Data (S-100). | |||||
BibTeX:
@article{schwehr2007g,
  author = {Schwehr, K. and Alexander, L.},
  title = {Encoding AIS Binary Messages in XML Format for Providing Hydrographic-related Information},
  journal = {Internation Hydrographic Review},
  year = {2007},
  volume = {8},
  number = {2},
  pages = {37-57},
  url = {http://vislab-ccom.unh.edu/~schwehr/papers/schwehr-alexander-2007-ihr.pdf}
}
|
|||||
| Schwehr, K. & Delgado, D. | GRASS Usage for Virtual Planetary Exploration [BibTeX] |
1994 | techreport | URL | |
BibTeX:
@techreport{schwehr1994,
  author = {Schwehr, K. and Delgado, D.},
  title = {GRASS Usage for Virtual Planetary Exploration},
  year = {1994},
  url = {http://vislab-ccom.unh.edu/~schwehr/papers/GrassManual/GrassVPE-1994.html}
}
|
|||||
| Schwehr, K., Driscoll, N. & Tauxe, L. | Origin of continental margin morphology: submarine-slide or downslope current-controlled bedforms, a rock magnetic approach | 2007 | Marine Geology Vol. doi:10.1016/j.margeo.2007.01.012(1-4), pp. 19-41 |
article | DOI URL |
| Abstract: Morphological features observed in both swath bathymetry and seismic reflection data are not unique, which introduces uncertainty as to their origin. The origin of features observed in the Humboldt Slide has generated much controversy because the same features have been interpreted as a submarine failure deposit versus current-controlled sediment waves. It is important to resolve this controversy because similar structures are observed on many continental margins and the origin of these features needs to be understood. Anisotropy of magnetic susceptibility (AMS) measurements on sediment samples acquired from the Humboldt Slide reveal that the top ~ 8 m have not experienced post-depositional deformation. This suggests that these features are formed by primary deposition associated with downslope currents. Using the same AMS technique on a core acquired north of the Humboldt Slide in a region with no geophysical evidence for post-depositional deformation, we were able to identify a ~ 1 m thick deposit that appears to be a small slump. | |||||
BibTeX:
@article{schwehr2007a,
  author = {Schwehr, K. and Driscoll, N. and Tauxe, L.},
  title = {Origin of continental margin morphology: submarine-slide or downslope current-controlled bedforms, a rock magnetic approach},
  journal = {Marine Geology},
  year = {2007},
  volume = {doi:10.1016/j.margeo.2007.01.012},
  number = {1-4},
  pages = {19-41},
  url = {http://vislab-ccom.unh.edu/~schwehr/papers/schwehr2007.pdf},
  doi = {http://dx.doi.org/10.1016/j.margeo.2007.01.012}
}
|
|||||
| Schwehr, K., Driscoll, N. & Tauxe, L. | Slumps and sediment deformation: AMS of the Gaviota and Goleta Slides | 2005 | AGU Fall Meeting Abstracts | article | URL |
| Abstract: During the last year, we have collected six gravity cores from the northern side of the Santa Barbara Basin for paleomagnetic deformation tests. The first two cores were collected on the smaller Gaviota Slide on the western side of the basin. These cores provide the slump end member, since one core comes from the evacuated zone while the other comes from the toe or accumulation zone. Two additional cores were collected on the toes of the much older Goleta Slides and were designed to provide an undeformed reference fabric; it was our hope that they would be mostly pelagic drape but also penetrate into the top of the deformed material. One core appears to be an excellent reference core with clear laminations, while the other has distorted laminations that show the sediment has undergone some type of deformation. In between the two slides, we collected two cores on either side of the crack that runs between the two slides to investigate creep and slope stability. All cores have been sampled at a 3 cm interval with 8cc cubes to measure anisotropy of magnetic susceptibility (AMS) and AF demagnetiziation. The Gaviota slide sediments show a dominantly triaxial fabric with some alignment of the maximum eigen values, while the drape materials from the Goleta Slide show a typical oblate undeformed fabric. There are hints of deformation at major clay layers, which we continue to investigate. Several of these cores appear to show a biogentic component to the AMS signal that fades with depth. This component has a tendency to mask the deformation signal in the top sections of the cores. The NRM inclinations of the deformed core regions tend to be shallow and erratic showing what look at first glance to be excursional features. Conclusion Through the use of AMS and percent weight water techniques, past slides and unconformities can be identified that were not necessarily visible in the core materials. It appears that sediment morphology is controlling the ability of sediments to dewater as they accumulate overburden. The laminated zones hinder fluid flow and create zones of overpressure. We believe these zones are weak and present likely failure points for future deformation. Our model predicts that in the area between the Gaviota and Goleta slides, the failure will likely occur at a depth of 85-100cm and fail in a manner much like the smaller Gaviota slide. Acknowledgments We would like to thank NSF and BP for funding this research. The multibeam data comes from the MBARI EM300 survey. Seismic processing was done by D. Brothers and J. Dingler. Core processing was done at the SIO Geologic Collections and the SIO Paleomagnetic Laboratory. |
|||||
BibTeX:
@article{schwehr2005c,
  author = {Schwehr, K. and Driscoll, N. and Tauxe, L.},
  title = {Slumps and sediment deformation: AMS of the Gaviota and Goleta Slides},
  journal = {AGU Fall Meeting Abstracts},
  year = {2005},
  url = {http://vislab-ccom.unh.edu/~schwehr/papers/schwehr2005-agu-sml.jpg}
}
|
|||||
| Schwehr, K., Driscoll, N. & Tauxe, L. | The Whole AMS Matrix: Using the Owens Lake, Ardath Slump, and Gaviota Slide cores to explore classification of ellipsoid shapes | 2004 | AGU Fall Meeting Abstracts Vol. 21, pp. 0149 |
article | URL |
| Abstract: Categorizing sediment history using Anisotropy of Magnetic Susceptibility (AMS) has been a long standing challenge for the paleomagnetic community. The goal is to have a robust test of shape fabrics that allows workers to classify sediments in terms of being primary depositional fabric, deposition in with currents, or altered fabrics. Additionally, it is important to be able to distinguish altered fabrics into such classes as slumps, crypto- slumps, drilling deformation (such as fluidization from drilling mud and flow-in), and so forth. To try to bring a unified test scheme to AMS interpretation, we are using three example test cases. First is the Owens Lake OL92 core, which has provided previous workers with a long core example in a lacustrian environment. OL92 was classified into five zones based on visual observations of the core photographs. Using these groupings, Rosenbaum et al. (2000) was able to use the deflection of the minimum eigen vector from vertical to classify each individual AMS sample. Second is the Ardath Shale location, which provides a clear case of a lithified outcrop scale problem that showed success with the bootstrap eigen value test. Finally is the Gaviota Slide in the Santa Barbara Basin, which provides usage of 1-2 meter gravity cores. Previous work has focused on Flinn, Jelinek, and bootstrap plots of eigen values. In supporting the shape characterization we have also used a 95% confidence F-Test by means of Hext’s statistical work. We have extended the F-Test into a promising new plot of the F12 and F23 confidence values, which shows good clustering in early tests. We have applied all of the available techniques to the above three test cases and will present how each technique either succeeds or fails. Since each method has its own strengths and weaknesses, it is clear that the community needs to carefully evaluate which technique should be applied to any particular problem. |
|||||
BibTeX:
@article{schwehr2004a,
  author = {Schwehr, K. and Driscoll, N. and Tauxe, L.},
  title = {The Whole AMS Matrix: Using the Owens Lake, Ardath Slump, and Gaviota Slide cores to explore classification of ellipsoid shapes},
  journal = {AGU Fall Meeting Abstracts},
  year = {2004},
  volume = {21},
  pages = {0149},
  url = {http://vislab-ccom.unh.edu/~schwehr/papers/schwehr2004-agu-sml.jpg}
}
|
|||||
| Schwehr, K., Driscoll, N. & Tauxe, L. | Deciphering the origin of the Humboldt Slide using Anisotropy of Magnetic Susceptibility | 2003 | EGS - AGU - EUG Joint Assembly, Abstracts from the meeting held in Nice, France, 6 - 11 April 2003, abstract 12756, pp. 12756 | article | URL |
| Abstract: The origin of the "so-called" Humboldt Slide has raised much controversy. Some researchers argue that it is a slide deposit, while others interpret the deposit as a depositional feature mantling an old slide scar formed by down-slope gravity flows. We recently adapted the standard paleomagnetic tool of Anisotropy of Magnetic Susceptibility (AMS) in order to detect minor post-depositional deformation (i.e., "crypto-slumps") in sedimentary successions and applied it to the Humboldt Slide controversy. Crypto-slumps are slumps that are not easily observed in outcrop or core samples. Undeformed sediments show a typical oblate fabric while even slightly deformed sediments develop a triaxial fabric. In the winter of 2001, we acquired 5 large diameter piston cores from the Humboldt Slide, Northern California based on a previous chirp seismic survey collected as part of the STRATAFORM project. The cores were acquired in two groups with the first being located in the center of the Humboldt Slide covering the upslope and downslope limb of one of the structures with one core located between the two structures. The second group of cores is located upslope near the top of the so-called Humboldt complex. Both groups are located in the extensional regime if this deposit is indeed a slump in an area morphologically described as the ridges and swales by Gardner et al. (1999). We measured the AMS on a total of 293 samples down-core and from these analyses we found that fabric was dominantly oblate except in regions that had experienced flow-in from the piston coring process. Based on these results, we conclude that the Humboldt Slide is not a slide. The ridges and swales appear to have grown as sediment waves on an old slide scar. We have corroborated this model with further analysis of our chirp seismics which show thickening on the upslope side of these structures and continuous reflectors across regions where others have mapped normal faults. |
|||||
BibTeX:
@article{schwehr2003b,
  author = {Schwehr, K. and Driscoll, N. and Tauxe, L.},
  title = {Deciphering the origin of the Humboldt Slide using Anisotropy of Magnetic Susceptibility},
  journal = {EGS - AGU - EUG Joint Assembly, Abstracts from the meeting held in Nice, France, 6 - 11 April 2003, abstract 12756},
  year = {2003},
  pages = {12756},
  url = {http://vislab-ccom.unh.edu/~schwehr/papers/schwehr2003-springagu-sml.jpg}
}
|
|||||
| Schwehr, K., Driscoll, N. & Tauxe, L. | Continued Exploration of the Humboldt Slide using Anisotropy of Magnetic Susceptibility [BibTeX] |
2003 | Oceans03 MTS/IEEE Poster | article | |
BibTeX:
@article{schwehr2003d,
  author = {Schwehr, K. and Driscoll, N. and Tauxe, L.},
  title = {Continued Exploration of the Humboldt Slide using Anisotropy of Magnetic Susceptibility},
  journal = {Oceans03 MTS/IEEE Poster},
  year = {2003}
}
|
|||||
| Schwehr, K., Driscoll, N., Tauxe, L. & Lee, H.J. | Exploration of the Humboldt Slide using Anisotropy of Magnetic Susceptibility - Comparison with the Gaviota Slide | 2003 | AGU Fall Meeting Abstracts Vol. 22, pp. 1150 |
article | URL |
| Abstract: The origin of the "so-called" Humboldt Slide has raised much controversy. Some researchers argue that it is a slide deposit, while others interpret the deposit as a depositional feature mantling an old slide scar formed by down-slope gravity flows. We adapted the standard paleomagnetic tool of Anisotropy of Magnetic Susceptibility (AMS) in order to detect minor post-depositional deformation (i.e., "crypto-slumps") in sedimentary successions and applied it to the Humboldt Slide controversy. Crypto-slumps are slumps that are not easily observed in outcrop or core samples. Undeformed sediments show a typical oblate fabric while even slightly deformed sediments develop a triaxial fabric. Based on examining cores from the center and top of the Humboldt Slide structure, we find no evidence for deformation. The cores from the top are in an area that is clearly free from drape and thus we can be sure that we are sampling the structure seen in chirp seismics. We recently sampled a known slide for comparison to the Humboldt Slide. We used 5 gravity cores from the USGS V1-81-SC cruise which sampled the Gaviota Slide. The Gaviota Slide in on the northern slope of the Santa Barbara Basin and is just to the west of the much larger Golita Slide. The AMS measurements from the Gaviota Slide show a clearly deformed fabric that we expect from a slide. From these analyses we found that the fabric is dominantly oblate for the Humboldt Slide while the Gaviota Slide is predominantly triaxial. Based on these results, we re-emphasize our conclusion that the Humboldt Slide is not a slide. We now know that the ridges and swales of the Humboldt Slide appear to have grown as sediment waves on an old slide scar and our chirp seismics show thickening on the upslope side of these structures and continuous reflectors across regions where others have mapped normal faults. | |||||
BibTeX:
@article{schwehr2003c,
  author = {Schwehr, K. and Driscoll, N. and Tauxe, L. and Lee, H. J.},
  title = {Exploration of the Humboldt Slide using Anisotropy of Magnetic Susceptibility - Comparison with the Gaviota Slide},
  journal = {AGU Fall Meeting Abstracts},
  year = {2003},
  volume = {22},
  pages = {1150},
  url = {http://vislab-ccom.unh.edu/~schwehr/papers/schwehr2003-fallagu-sml.jpg}
}
|
|||||
| Schwehr, K., Hatch, L., Thompson, M. & Wiley, D. | Google Earth Visualizations of the Marine Automatic Identification System (AIS): Monitoring Ship Traffic in National Marine Sanctuaries | 2007 | AGU Fall 2007 | inproceedings | URL |
| Abstract: The Automatic Identification System (AIS) is a new technology that provides ship position reports with location, time, and identity information without human intervention from ships carrying the transponders to any receiver listening to the broadcasts. In collaboration with the USCG's Research and Development Center, NOAA's Stellwagen Bank National Marine Sanctuary (SBNMS) has installed 3 AIS receivers around Massachusetts Bay to monitor ship traffic transiting the sanctuary and surrounding waters. The SBNMS and the USCG also worked together propose the shifting the shipping lanes (termed the traffic separation scheme; TSS) that transit the sanctuary slightly to the north to reduce the probability of ship strikes of whales that frequent the sanctuary. Following approval by the United Nation's International Maritime Organization, AIS provided a means for NOAA to assess changes in the distribution of shipping traffic caused by formal change in the TSS effective July 1, 2007. However, there was no easy way to visualize this type of time series data. We have created a software package called noaadata-py to process the AIS ship reports and produce KML files for viewing in Google Earth. Ship tracks can be shown changing over time to allow the viewer to feel the motion of traffic through the sanctuary. The ship tracks can also be gridded to create ship traffic density reports for specified periods of time. The density is displayed as map draped on the sea surface or as vertical histogram columns. Additional visualizations such as bathymetry images, S57 nautical charts, and USCG Marine Information for Safety and Law Enforcement (MISLE) can be combined with the ship traffic visualizations to give a more complete picture of the maritime environment. AIS traffic analyses have the potential to give managers throughout NOAA's National Marine Sanctuaries an improved ability to assess the impacts of ship traffic on the marine resources they seek to protect. Viewing ship traffic data through Google Earth provides ease and efficiency for people not trained in GIS data processing. |
|||||
BibTeX:
@inproceedings{schwehr2007e,
  author = {Schwehr, K. and Hatch, L. and Thompson, M. and Wiley, D.},
  title = {Google Earth Visualizations of the Marine Automatic Identification System (AIS): Monitoring Ship Traffic in National Marine Sanctuaries},
  booktitle = {AGU Fall 2007},
  publisher = {AGU},
  year = {2007},
  url = {http://vislab-ccom.unh.edu/~schwehr/papers/schwehr-agu2007.jpg}
}
|
|||||
| Schwehr, K., Johnson, C.L., Kilb, D., Nayak, A. & Nishimura, C. | Visualization tools facilitate geological investigations of Mars exploration rover landing sites | 2005 | Vol. 5669-15Electronic Imaging Science and Technology; Visualization and Data Analysis, pp. 135-145 |
inproceedings | URL |
| Abstract: The current rate of Mars exploration data acquisition demands that geoscientists and computer scientists coordinate central storage, processing and visualization strategies to anticipate future technological advancements. We investigate how existing 3-D visualization tools can be used to study a part of the Mars orbiter and lander data (about 4 terabytes of data). Our tools assist in juxtaposition of different datum and in viewing data that spans multiple orders of magnitude, specifically for current scientific research pertaining to Mars" geophysics and geology. These tools also permit effective data fidelity and resolution assessment, allowing quick identification of problems related to the use of differing spatial coordinate systems, a continued problem. Knowledge gained from the small dataset we test, helps us identify key tools needed to accommodate the technology required to process and analyze approximately 64 terabytes of Mars data expected by 2008. We use the current planetary data archives, and identify key visualization techniques and tools that distill multiple data types into manageable end products. Our goal is to broaden the user base, using readily available platform-independent freeware packages, while simultaneously including sufficient modularity to be compatible with future technologies. | |||||
BibTeX:
@inproceedings{schwehr2005b,
  author = {Schwehr, K. and Johnson, C. L. and Kilb, D. and Nayak, A. and Nishimura, C.},
  title = {Visualization tools facilitate geological investigations of Mars exploration rover landing sites},
  booktitle = {Electronic Imaging Science and Technology; Visualization and Data Analysis},
  publisher = {SPIE},
  year = {2005},
  volume = {5669-15},
  pages = {135-145},
  url = {http://vislab-ccom.unh.edu/~schwehr/papers/schwehr-etal-vda05-paper2.pdf}
}
|
|||||
| Schwehr, K. & Mission, S.I.M. | Mars Surface Science, Precursor Rover Mission Options, Exploration Vehicle Science Equipment, and Autonomous Rovers and Virtual Environments | 1993 | 1993 Stanford International Mars Mission | incollection | URL |
| Abstract: The goal of the Surface Exploration Vehicle (SEV) is to allow two of the scientists on the astronaut team to explore a larger area than just the immediate base site. The SEV should provide as complete a field laboratory as possible while still being easy to use. For the first excursion, the focus of the SEV is on-surface and near-surface geology with some work in exobiology. In addition to the equipment in and on the vehicle, several science stations will be deployed at locations that are deemed interesting and useful by the astronauts and scientists on Earth. For continuing SEV trips, the SEV will be upgraded and changed to allow for a variety of other experiments as well as extending the original suite. | |||||
BibTeX:
@incollection{schwehr1993,
  author = {Schwehr, K. and Mission, Stanford Internation Mars},
  title = {Mars Surface Science, Precursor Rover Mission Options, Exploration Vehicle Science Equipment, and Autonomous Rovers and Virtual Environments},
  booktitle = {1993 Stanford International Mars Mission},
  publisher = {Stanford University, Dept of Engineering},
  year = {1993},
  note = {Carl Sagan and Jack Schmidt both met with the SIMM 1993 team.},
  url = {http://vislab-ccom.unh.edu/~schwehr/papers/SIMM93}
}
|
|||||
| Schwehr, K. & Nguyen, L. | Viz Technical Notes: Design and Implementation of the Viz Architecture |
1998 | techreport | URL | |
| Abstract: The previous visualization package from IMG includes more features than just rendering. The design of viz is focussed on providing a solid rendering engine. The goal is to provide a more efficient basic rendering server, to allow the designer to isolate the rendering functions from the rest of the application that (s)he is designing. We focused on modular design and rapid proto-typing. We did not try to replicate the entire functionality of the Inventor API outside of the server. We used messages to try to provide a clear and simple API for several reasons: 1. To make it easy to add support for additional scripting or compiled languages. 2. To make it easier to maintain the server code. 3. Easier to learn than the full OpenInventor API -- rapid prototyping. If you want more elaborate interaction with the 3D environment or fancy stuff (TM), we recommend that you write a custom C++ Inventor application. Viz is not intended to support any arbitrary change to the scene graph or user interaction. This allows us to build a scene graph that we can count on to have a number of necessary properties. | |||||
BibTeX:
@techreport{schwehr1998,
author = {Schwehr, K. and Nguyen, L.},
title = {Viz Technical Notes: |
|||||
| Schwehr, K., Sullivan, B. & Gardner, J.V. | Google Earth Visualizations: Preview and Delivery of Hydrographic and Other Marine Datasets | 2007 | US Hydro | inproceedings | URL |
| Abstract: Existing hydrographic data analysis and visualization tools are very powerful, but lack easy access to web data management tools. Virtual globe software provides a gateway to a host of important data products in formats usable by specialized tools such as CARIS, Fledermaus, and Arc/Info. With virtual globe interfaces, users see complimentary and consistent geographic representations of available data in an easy-to-navigate format. We present a preview of visualizations that build upon virtual globe software. These examples are viewed in Google Earth, but could also be implemented in a number of alternative programs (e.g. NASA World Wind, Dapple, OSSIM Planet). We have assembled Google Earth visualizations from three datasets to illustrate each of the four primary types of data (handle point, line, area, and time data). The USCG Marine Information for Safety and Law Enforcement (MISLE) database of ship incidents illustrates point data. A short sample of the USCG National Automatic Identification System logs (N-AIS) demonstrates rendering of line data. Area data is exemplified in the United Nations Convention f the Law of the Sea (UNCLOS) multibeam bathymetry. Point, line and area data are combined to present a preview of S57 chart information. Finally, the MISLE database uses time to show maritime incidents that occurred in US waterways. The visualizations for our initial work were created with hand coding and small scripts. However, tools such as Fledermaus and RockWare have added Google Earth export functionality that makes authoring Google Earth resources easy to construct. For large dataset that require additional processing and analyses, Google Earth visualizations can offer users a range of download formats and suggest what software to use. We believe that this virtual globe-based-approach can make geospatial data sets more widely accessible via the world-wide-web. | |||||
BibTeX:
@inproceedings{schwehr2007b,
  author = {Schwehr, Kurt and Sullivan, Briana and Gardner, James V.},
  title = {Google Earth Visualizations: Preview and Delivery of Hydrographic and Other Marine Datasets},
  booktitle = {US Hydro},
  year = {2007},
  note = {Abstract and talk only},
  url = {http://vislab-ccom.unh.edu/~schwehr/papers/2007-schwehr-ushydro-googleearth-abstract.doc}
}
|
|||||
| Schwehr, K. & Tauxe, L. | Characterization of soft-sediment deformation; detection of cryptoslumps using magnetic methods | 2003 | Geology Vol. 31(3), pp. 203-206 |
article | DOI URL |
| Abstract: Many workers have explored anisotropy of magnetic susceptibility (AMS) of sediments as an indicator of deformation. Several studies have used deflection of the eigenvector associated with the minimum in susceptibility, V3, as a criterion for deformation. We examine the AMS record of a well-exposed slump and find that although demonstrable deformation can occur without deflecting the V3 directions, an oblate AMS fabric is transformed into a triaxial fabric during initial deformation. Transformation of the fabric from oblate to triaxial appears to be highly correlated with an increase in natural remanent magnetization scatter, whereas deflection of the V3 axes is not. We suggest that subtle soft-sediment deformation can be detected by using AMS fabric. | |||||
BibTeX:
@article{schwehr2003a,
  author = {Schwehr, K. and Tauxe, L.},
  title = {Characterization of soft-sediment deformation; detection of cryptoslumps using magnetic methods},
  journal = {Geology},
  year = {2003},
  volume = {31},
  number = {3},
  pages = {203-206},
  note = {http://dx.doi.org/10.1130%2F0091-7613%282003%29031%3C0203%3ACOSSDD%3E2.0.CO%3B2},
  url = {http://vislab-ccom.unh.edu/~schwehr/papers/SchwehrTauxe2003.pdf},
  doi = {http://dx.doi.org/10.1130/0091-7613(2003)031<0203:COSSDD>2.0.CO;2}
}
|
|||||
| Schwehr, K., Tauxe, L., Driscoll, N. & Lee, H.J. | Detecting compaction disequilibrium with anisotropy of magnetic susceptibility | 2006 | Geochem. Geophys. Geosyst. Vol. 7(Q11002), pp. 18 |
article | DOI URL |
| Abstract: In clay-rich sediment, microstructures and macrostructures influence how sediments deform when under stress. When lithology is fairly constant, anisotropy of magnetic susceptibility (AMS) can be a simple technique for measuring the relative consolidation state of sediment, which reflects the sediment burial history. AMS can reveal areas of high water content and apparent overconsolidation associated with unconformities where sediment overburden has been removed. Many other methods for testing consolidation and water content are destructive and invasive, whereas AMS provides a nondestructive means to focus on areas for additional geotechnical study. In zones where the magnetic minerals are undergoing diagenesis, AMS should not be used for detecting compaction state. By utilizing AMS in the Santa Barbara Basin, we were able to identify one clear unconformity and eight zones of high water content in three cores. With the addition of susceptibility, anhysteretic remanent magnetization, and isothermal remanent magnetization rock magnetic techniques, we excluded 3 out of 11 zones from being compaction disequilibria. The AMS signals for these three zones are the result of diagenesis, coring deformation, and burrows. In addition, using AMS eigenvectors, we are able to accurately show the direction of maximum compression for the accumulation zone of the Gaviota Slide. | |||||
BibTeX:
@article{schwehr2006,
  author = {Schwehr, Kurt and Tauxe, Lisa and Driscoll, Neal and Lee, Homa J.},
  title = {Detecting compaction disequilibrium with anisotropy of magnetic susceptibility},
  journal = {Geochem. Geophys. Geosyst.},
  year = {2006},
  volume = {7},
  number = {Q11002},
  pages = {18},
  note = {http://vislab-ccom.unh.edu/~schwehr/papers/Schwehr-etal2006-sbb.kml},
  url = {http://vislab-ccom.unh.edu/~schwehr/papers/Schwehr-etal2006-sbb.pdf},
  doi = {http://dx.doi.org/10.1029/2006GC001378}
}
|
|||||
| Schwehr, K.D., Derbes, A.D., Edwards, L., Nguyen, L. & Zbinden, E. | Designing visualization software for ships and robotic vehicles | 2005 | Vol. 5669-23Electronic Imaging Science and Technology; Visualization and Data Analysis, pp. 226-237 |
inproceedings | URL |
| Abstract: One of the challenges of visualization software design is providing real-time tools capable of concurrently displaying data that varies temporally and in scale from kilometers to micrometers, such as the data prevalent in planetary exploration and deep-sea marine research. The Viz software developed by NASA Ames and the additions of the X-Core extensions solve this problem by providing a flexible framework for rapidly developing visualization software capable of accessing and displaying large dynamic data sets. This paper describes the Viz/X-Core design and illustrates the operation of both systems over a number of deployments ranging from marine research to Martian exploration. Highlights include a 2002 integration with live ship operations and the Mars Exploration Rovers Spirit and Opportunity. | |||||
BibTeX:
@inproceedings{schwehr2005a,
  author = {Schwehr, K. D. and Derbes, A. D. and Edwards, L. and Nguyen, L. and Zbinden, E.},
  title = {Designing visualization software for ships and robotic vehicles},
  booktitle = {Electronic Imaging Science and Technology; Visualization and Data Analysis},
  publisher = {SPIE},
  year = {2005},
  volume = {5669-23},
  pages = {226-237},
  url = {http://vislab-ccom.unh.edu/~schwehr/papers/schwehr-etal-vda05.pdf}
}
|
|||||
| Schwehr, K.D. & McGillivary, P.A. | Marine Ship Automatic Identification System (AIS) for Enhanced Coastal Security Capabilities: An Oil Spill Tracking Application | 2007 | Oceans07 MTS/IEEE, pp. 9 | article | URL |
| Abstract: National and international trade via shipping is already significant, and expected to continue increasing rapidly over the next decade. Both more ships and larger ships will contribute to this trade, including ships from countries with less rigorous shipping maintenance and inspection standards than the United States, and less strict pollution monitoring regulations. Changes in ship traffic management protocols have been implemented in recent years in the U.S. to minimize damage to coastlines, particularly near sensitive or protected marine environments. For example, to reduce risk to coastal resources off central California, shipping lanes for larger vessels were moved further offshore to allow for additional response time in case of accidents before such vessels might drift into coastal areas. Similarly, ships are now routed via specific approach channels when entering Boston Harbor to reduce impacts within adjacent National Marine Sanctuary resources. Several recent high profile cases have occurred where ‘mystery’ oil spills were found near shipping channels, but no vessel could be readily identified as their source. These incidents lead to extensive and expensive efforts to attempt to identify the ships responsible. As time passes in responding to these incidents, the likelihood of confirming the identity of the ships diminishes. Unfortunately, reports of vessels engaging in illegal oily waste discharge to reduce fees for offloading the waste in port are ongoing. We here discuss use of improved capabilities of near-continuous real-time position location monitoring of shipping traffic using marine Automatic Identification Systems (AIS) for ships that would facilitate identification of ships responsible for illegal oily waste discharge. The next phase of the National AIS, N-AIS Increment 2, can supply additional spatial coverage not currently included in the N-AIS Increment 1, which can provide an enhanced capability for monitoring shipping and improving management of coastal ship traffic and response to pollution incidents. These methods will not only improve response time, but reduce cost of response as well. | |||||
BibTeX:
@article{schwehr2007d,
  author = {Schwehr, K. D. and McGillivary, P. A.},
  title = {Marine Ship Automatic Identification System (AIS) for Enhanced Coastal Security Capabilities: An Oil Spill Tracking Application},
  journal = {Oceans07 MTS/IEEE},
  year = {2007},
  pages = {9},
  url = {http://vislab-ccom.unh.edu/~schwehr/papers/SchwehrMcGillivaryOceansMTS2007.pdf}
}
|
|||||
| Schwehr, K., A.A.B.R.F.D.S.J.S.S. | Bathymtric Attributed Grids (BAGs): Discovery of Marine Datasets and Geospatial Metadata Visualization | 2010 | Canadian Hydrographic Conference | article | URL |
| Abstract: NOAA's National Geophysical Data Center (NGDC) provides the deep archive of US multibeam sonar hydrographic surveys. NOAA stores the data as Bathymetric Attributed Grids (BAG; http://www.opennavsurf.org/) that are HDF5 formatted files containing gridded bathymetry, gridded uncertainty, and XML metadata. While NGDC provides the deep store and a basic ERSI ArcIMS interface to the data, additional tools need to be created to increase the frequency with which researchers discover hydrographic surveys that might be beneficial for their research. Using both Open Source tools and IVS3D Fledermaus, we have created a draft of a Google Earth visualization of NOAA's complete collection of BAG files as of March 2009. Each survey is represented as a bounding box, an optional preview image of the survey data, and a pop up placemark. The placemark contains a brief summary of the metadata and links to directly download of the BAG survey files and the complete metadata file. When viewed from a distance, multiple BAG icons are merged into a super-?? icon to declutter the regional view. Each survey is time tagged so that users can search both in space and time for surveys that meet their needs. By creating these visualizations, we aim to make the entire process of data discovery, validation of relevance, and download much more efficient for research scientists who may not be familiar with NOAA's hydrographic survey efforts or the BAG format. In the process of creating this demonstration, we have identified a number of improvements that can be made to the hydrographic survey process in order to make the results easier to use especially with respect to metadata generation. The ability to use multiple tools to inspect and view all aspects of BAGs will allow Hydrographic Offices to insure better Quality Assurance (QC) of their hydrographic grid products. With the combination of the NGDC deep archiving infrastructure, a Google Earth virtual globe visualization, and GeoRSS feeds of updates, we hope to increase the utilization of these high-??quality gridded bathymetry. This workflow applies equally well to LIDAR topography and bathymetry. Additionally, with proper referencing and geotagging in journal publications, we hope to close the loop and help the community create a true "Geospatial Scholar" infrastructure. |
|||||
BibTeX:
@article{schwehr2010b,
  author = {Schwehr, K., Armstrong, A., Brennan, R., Fischmann, D., Sellars, J., Smith, S.},
  title = {Bathymtric Attributed Grids (BAGs): Discovery of Marine Datasets and Geospatial Metadata Visualization},
  journal = {Canadian Hydrographic Conference},
  year = {2010},
  url = {http://vislab-ccom.unh.edu/~schwehr/papers/2010chc/2010-chc-bag-viz-abstract.pdf}
}
|
|||||
| Singh, S., Schwehr, K., Simmons, R., Smith, T., Stentz, A., Verma, V. & Yahja, A. | Recent Progress in Local and Global Traversability for Planetary Rovers | 2000 | ICRA, pp. 7 | inproceedings | URL |
| Abstract: Autonomous planetary rovers operating in vast unknown environments must operate efficiently because of size, power and computing limitations. Recently, we have developed a rover capable of efficient obstacle avoidance and path planning. The rover uses binocular stereo vision to sense potentially cluttered outdoor environments. Navigation is performed by a combination of several modules that each ÒvoteÓ for the next best action for the robot to execute. The key distinction of our system is that it produces globally intelligent behavior with a small computational resource, all processing and decision making is done on a single processor. These algorithms have been tested on our prototype rover, Bullwinkle, outdoors and have recently driven the rover 100 m at speeds of 15 cm/ sec. In this paper we report on the extensions on the systems that we have previously developed that were necessary to achieve autonomous navigation in this domain. | |||||
BibTeX:
@inproceedings{singh2000,
  author = {Singh, Sanjiv and Schwehr, Kurt and Simmons, Reid and Smith, Trey and Stentz, Anthony and Verma, Vandi and Yahja, Alex},
  title = {Recent Progress in Local and Global Traversability for Planetary Rovers},
  booktitle = {ICRA},
  publisher = {IEEE},
  year = {2000},
  pages = {7},
  url = {http://vislab-ccom.unh.edu/~schwehr/papers/2000-ICRA-singh_sanjiv_1.pdf}
}
|
|||||
| Stoker, C.R., Barch, D., Farmer, J., Flagg, M., Healy, T., Tengdin, T., Thomas, H., Schwer, K. & Stakes, D. | Exploration Of Mono Lake With An ROV: a prototype experiment for the MAPS AUV program | 1996 | Autonomous Underwater Vehicle Technology, 1996., pp. 33-40 | inproceedings | URL |
| Abstract: This paper describes a field experiment to explore Mono Lake using the Telepresence Controlled Remotely Operated Vehicle (TROV). This experiment was a prototype study demonstrating the science capabilities defined for a new AUV planned for development by a consortium project called MAPS. The goal of the experiment was to study mineralization processes associated with thermal and non-thermal spring inflow into Mono Lake, a hypersaline, alkaline lake in eastern California located in a volcanically active area. TROV is a tethered ROV, which can be controlled using a virtual reality-based user interface. TROV's video capabilities included a matched pair of stereo video cameras on a rapid pan and tilt platform and a single fixed downward pointing camera. Additional capabilities included high resolution 750 kHz pencil beam SONAR and 1 MHz scanning SONAR for navigating in the murky water, instruments for measuring water column properties (C,T,D, pH), a syringe water sample, and a three function manipulator arm used to collect mineral samples and place them in a sample box mounted on the vehicle. TROV was navigated using a DiveTracker acoustic navigation system. TROV was deployed from the deck of a houseboat anchored above the field sites with control and data recording equipment also onboard. The boat's location was continuously recorded using differential GPS system during 10 days of field operations. TROV had a total of 38 hours of bottom time. We studied 4 sites including (1) a broad, gently sloping, ooze-covered mound SE of Paoha island with copious methane gas seeps, (2) shallow, tufa-coated pinnacles of volcanic origin associated with islets NE of Paoha Island, (3) subaqueous thermal springs located along the SE shore of Paoha Island, and (4) a deep area (~50m) E of Paoha Island. |
|||||
BibTeX:
@inproceedings{stoker1996,
  author = {Stoker, C. R. and Barch, D. and Farmer, J. and Flagg, M. and Healy, T. and Tengdin, T. and Thomas, H. and Schwer, K. and Stakes, D.},
  title = {Exploration Of Mono Lake With An ROV: a prototype experiment for the MAPS AUV program},
  booktitle = {Autonomous Underwater Vehicle Technology, 1996.},
  publisher = {IEEE},
  year = {1996},
  pages = {33-40},
  note = {Schwehr was mispelled as Schwer},
  url = {http://vislab-ccom.unh.edu/~schwehr/papers/MonoLake-MAPS/MonoLake-MAPS-1996.pdf}
}
|
|||||
| Stoker, C.R., Blackmon, T., Hagen, J., Henning, P., Kanefsky, B., Neveu, C., Rasmussen, D., Schwehr, K., Sims, M. & Zbinden, E. | MarsMap: Analyzing Pathfinder Data using Virtual Reality | 1997 | AGU | inproceedings | URL |
| Abstract: The Pathfinder mission made use of a unique capability to rapidly generate and interactively display three-dimensional Dphoto-realistic virtual reality (VR) models of the Martian surface. Marsmap, the interactive terrain visualization system developed for Pathfinder by the Intelligent Mechanisms Group at NASA Ames as part of a participating science project, creates and renders digital terrain models produced from stereo images of Mars surface taken by the landers IMP camera. An automated machine vision algorithm produces dense range maps of the near visible field by matching features in the left and right IMP camera images using the known camera geometry. The resulting range maps are then projected into a three-dimensional model as a connected polygonal mesh. IMP images or color composites are then e Coverlaid onto the mesh as textures to provide photo-realism in the model. Upon receipt at NASA JPL, IMP images were shipped to NASA Ames Research Center via internet where models were computed and then shipped back to JPL for display. The time from receipt of image data to display of complete models was less than 30 minutes. The VR models are viewed interactively using an interface that allows reprojection from any perspective driven by a standard three-button computer mouse. Terrain models are rendered at a frame rate of up to 60 frames per second using a Silicon Graphics Onyx 2 computer, allowing the user to move smoothly though the interactive model environment. The model can be viewed on a monitor either mono or stereoscopically, or using a head-tracked VR display. The VR model also incorporates graphical representations of the lander and the sequence and spatial locations at which rover data were taken. As the rover moves, graphical models of the rover are added for each position that can uniquely determined using stereo images of the rover taken by IMP. Images taken by Sojourner are projected into the model as two-dimensional billboards to show the proper perspective of these images. Distance and angle measurements can be made on features viewed in the model using a mouse-driven three-dimensional cursor and a point-and-click interface. The VR model was used to assist with archiving and planning on Sojourner activities. It is also used to make detailed measurements of surface features, such as wind streaks and rock size and orientation, that are difficult to perform using two-dimensional images. |
|||||
BibTeX:
@inproceedings{stoker1997,
  author = {Stoker, C. R. and Blackmon, T. and Hagen, J. and Henning, P. and Kanefsky, B. and Neveu, C. and Rasmussen, D. and Schwehr, K. and Sims, M. and Zbinden, E.},
  title = {MarsMap: Analyzing Pathfinder Data using Virtual Reality},
  booktitle = {AGU},
  year = {1997},
  url = {http://vislab-ccom.unh.edu/~schwehr/papers/stoker-marsmap-agu-1997.txt}
}
|
|||||
| Stoker, C.R., Blackmon, T., Hagen, J., Kanefsky, B., Rasmussen, D., Schwehr, K., Sims, M. & Zbinden, E. | Marsmap: an Interactive Virtual Reality Model of the Pathfinder Landing Site | 1998 | Vol. 29Lunar and Planetary Institute Conference Abstracts, pp. 1018 |
inproceedings | URL |
| Abstract: The Pathfinder mission made use of a unique capability to rapidly generate and interactively display three-dimensional photo-realistic virtual reality (VR) models of the Martian surface. Marsmap, the interactive terrain visualization sys- tem developed for Pathfinder by the authors as part of a participating science project, creates and renders digital terrain models produced from stereo images of Mars' surface taken by the lander’s IMP camera. A primary benefit of using VR to display geologic information is that it provides an improved perception of depth and spatial layout of the remote site. The VR aspect of the display allows an opera- tor to move freely in the environment, unconstrained by the physical limitations of the perspective from which the data were acquired. Virtual Reality also offers a way to archive and retrieve information in a way that is easily understood. Combining the VR models with stereo display systems can enable a feeling of presence at the remote location. The capability, implemented in Marsmap, to interactively per- form measurements from within the VR model offered un- precedented ease in performing operations that are normally time consuming and difficult using standard photogrametric techniques. This ground-breaking project demonstrated the power of using Virtual Reality as a cartographic tool. | |||||
BibTeX:
@inproceedings{stoker1998,
  author = {Stoker, C. R. and Blackmon, T. and Hagen, J. and Kanefsky, B. and Rasmussen, D. and Schwehr, K. and Sims, M. and Zbinden, E.},
  title = {Marsmap: an Interactive Virtual Reality Model of the Pathfinder Landing Site},
  booktitle = {Lunar and Planetary Institute Conference Abstracts},
  year = {1998},
  volume = {29},
  pages = {1018},
  url = {http://vislab-ccom.unh.edu/~schwehr/papers/lpsc-pathfinder-1998.pdf}
}
|
|||||
| Stoker, C.R., Zbinden, E., Blackmon, T.T., Kanefsky, B., Hagen, J., Neveu, C., Rasmussen, D., Schwehr, K. & Sims, M. | Analyzing Pathfinder data using virtual reality and superresolved imaging | 1999 | Journal of Geophysical Research Vol. 104, pp. 8889-8906 |
article | URL |
| Abstract: The Mars Pathfindermissionuseda uniquecapabilityto rapidlygenerateand interactivelydisplaythree-dimensiona(l3-D) photorealistic virtualreality(VR) modelsof the Martian surface. An interactive terrain visualization system creates and rendersdigital terrain models produced from stereo images taken by the Imager for Mars Pathfinder (IMP) camera. The stereopipeline, an automated machine vision algorithm, correlates features between the left and right images to determine their disparity and computes the corresponding positions using the known camera geometry. These positions are connected to form a polygonal mesh upon whichIMP images are overlaid as textures. During the Pathfinder mission,VR models were produced and displayed almost as fast as images were received. The VR models were viewed using MarsMap, an interface that allows the model to be viewed from any perspective driven by a standard three-button computer mouse. MarsMap incorporates graphical representations of the lander and rover and the sequenceand spatiallocationsat whichroverdatawere taken.Graphicalmodelsof the roverwere placedin the model to indicatethe rover positionat the end of eachday of the mission. Imagestaken by Sojournercamerasare projectedinto the model as 2-D "billboards"to show their proper perspective. Distance and angle measurements can be made on features viewed in the model usinga mouse-driven3-D cursorand a point-and- click interface. MarsMap wasusedto assistwith archivingandplanningSojourner activities and to make detailed measurements of surface features such as wind streaks and rock size and orientation that are difficult to performusing 2-D images. Superresolution image processing is a computationl method for improving image resolution by a factor of n1/2 by combininng independen imtagesT.histechniquweasusedonPathfindetroobtain better resolvedimagesof Martian surfacefeatures.We showresultsfrom superresolving IMP camera images of six targets including near- and far-field objects and discuss how the resolution improvements aid interpretation. Similar flood deposits can be seen on both of the Twin Peaks that cannot be resolved in raw images. Millimeter-sized pits are resolved on the rocksWedge and Halfdome. Other rocksat the Pathfindersite exhibit fine-scale layering that is otherwise invisible. Use of the method resulted in the probable discovery of an artifact of intelligent life on Mars: a part of the Pathfinder spacecraft. |
|||||
BibTeX:
@article{stoker1999,
  author = {Stoker, Carol R. and Zbinden, Eric and Blackmon, Theodore T. and Kanefsky, Bob and Hagen, Joel and Neveu, Charles and Rasmussen, Daryl and Schwehr, Kurt and Sims, Michael},
  title = {Analyzing Pathfinder data using virtual reality and superresolved imaging},
  journal = {Journal of Geophysical Research},
  year = {1999},
  volume = {104},
  pages = {8889-8906},
  url = {http://vislab-ccom.unh.edu/~schwehr/papers/stoker1999-jgr-pathfinder.pdf}
}
|
|||||
| Wettergreen, D., Bualat, M., Christian, D., Schwehr, K., Thomas, H., Tucker, D. & Zbinden, E. | Operating Nomad during the Atacama Desert Trek | 1997 | Field and Service Robotics | inproceedings | URL |
| Abstract: Nomad is a mobile robot designed for extended planetary exploration. In June and July of 1997, Nomad performed the first such mission, traversing more than 220 kilometers in the Atacama Desert of Chile and exploring a landscape analogous to that of the Moon and Mars. Nomad's journey, the Atacama Desert Trek, was an unprecedented demonstration of long-distance, long-duration robotic operation. Guided by operators thousands of kilometers away but telepresent via immersive imagery and interfaces, Nomad operated continuously for 45 days. Science field experiments evaluated exploration strategies and analysis techniques for future terrestrial and planetary missions. | |||||
BibTeX:
@inproceedings{wettergreen1997,
  author = {Wettergreen, D. and Bualat, M. and Christian, D. and Schwehr, K. and Thomas, H. and Tucker, D. and Zbinden, E.},
  title = {Operating Nomad during the Atacama Desert Trek},
  booktitle = {Field and Service Robotics},
  year = {1997},
  url = {http://vislab-ccom.unh.edu/~schwehr/papers/nomad-fsr97.pdf}
}
|
|||||
| Wiley, David N, C.W.C.L.H.L.J.K.K.R.M.K.S.G.S.B.T.M.T. | Reducing the risk of ship strike to endangered whales in the Stellwagen Bank National Marine Sanctuary [BibTeX] |
2009 | International Marine Conservation Congress (IMCC), Smithsonian's Beyond the Obituaries: Success Stories in Ocean Conservation | conference | |
BibTeX:
@conference{wiley2009,
  author = {Wiley, David N, C. W. Clark, L. Hatch, L. Johnson, K. Koyama, R. Merrick, K. Schwehr, G. Silber, B. Tetreault, M. Thompson},
  title = {Reducing the risk of ship strike to endangered whales in the Stellwagen Bank National Marine Sanctuary},
  booktitle = {International Marine Conservation Congress (IMCC), Smithsonian's Beyond the Obituaries: Success Stories in Ocean Conservation},
  year = {2009}
}
|
|||||
| Zbinden, E., Nguyen, L. & Schwehr, K. | Viz: An Automated 3D Mapping System for Planetary Exploration | 2000 | ISPRS II/I Amsterdam | inproceedings | URL |
| Abstract: The fast pace of NASA’s Mars Surface Exploration missions, combined with the high quantity of data returned and the complexity of controlling a robot millions of miles away, require the development of new tools allowing mission personnel to rapidly and accurately visualize and analyze all the information necessary for daily operation planning activities and science analysis. In this paper we describe the concept behind Viz and the Ames-Stereo-Pipeline, a near real time and fully automated mapping system developed to alleviate this shortcoming. The Ames-Stereo-Pipeline automatically produces accurate photorealistic virtual model patches of the terrain as images are received from the spacecraft. Terrain patches created from individual image pairs are mosaiced together to form a model of the lander or rover’s surroundings. Local models can be integrated with regional digital elevation maps (DEM) created from orbital, descent or aerial images. This integrated model can then be displayed in Viz, a custom virtual reality interface responding to mission operation and science needs. Viz allows mission engineers and scientists to view the remote work site from any perspective (virtual camera), to measure feature positions and distributions, to simulate robotic activities, to replay telemetry files and to generate command sequences for the spacecraft. The integration of data covering multiple orders of magnitude in size into a single model allows the operator to naturally and effortlessly place local features into their global or regional context. We review the use of Viz and its predecessors in support of planetary or terrestrial missions including: the Mars Pathfinder mission, the Mars Surveyor Polar Lander mission, The 3D mapping of the Chornobyl nuclear accident site, and the hot springs mapping expedition in Yellowstone national park. | |||||
BibTeX:
@inproceedings{zbinden2000,
  author = {Zbinden, E. and Nguyen, L. and Schwehr, K.},
  title = {Viz: An Automated 3D Mapping System for Planetary Exploration},
  booktitle = {ISPRS II/I Amsterdam},
  year = {2000},
  url = {http://vislab-ccom.unh.edu/~schwehr/papers/ISPRS-2000-Amsterdam.pdf}
}
|
|||||
| Zbinden, E., Stoker, C.R., Blackmon, T., Schwehr, K., Henning, P., Neveu, C. & Kanefsky, B. | Mapping Mars Using Virtual Reality: The Pathfinder Experience | 1998 | ISPRS WG IV/5 | inproceedings | URL |
| Abstract: The objectives of this project were to 1) automatically generate photo-realistic terrain models at downlink rate and with low latency and 2) validate the use of virtual reality interfaces for science analysis and day-to-day mission planning. Remote processing was done at NASA Ames using a dedicated ATM network link with 30 minute turn around time of completed models in under 30 minutes. The rendering of the models was accomplished fast enough to allow realtime user interaction. The system was used by pathfinder scientists, mission controllers and rover operators. Low resolution VRML models were made available to the general public and used for public outreach. | |||||
BibTeX:
@inproceedings{zbinden1998,
  author = {Zbinden, E. and Stoker, C. R. and Blackmon, T. and Schwehr, K. and Henning, P. and Neveu, C. and Kanefsky, B.},
  title = {Mapping Mars Using Virtual Reality: The Pathfinder Experience},
  booktitle = {ISPRS WG IV/5},
  year = {1998},
  url = {http://vislab-ccom.unh.edu/~schwehr/papers/zbinden-etal-98.pdf}
}
|
|||||
Created by JabRef on 04/01/2011.
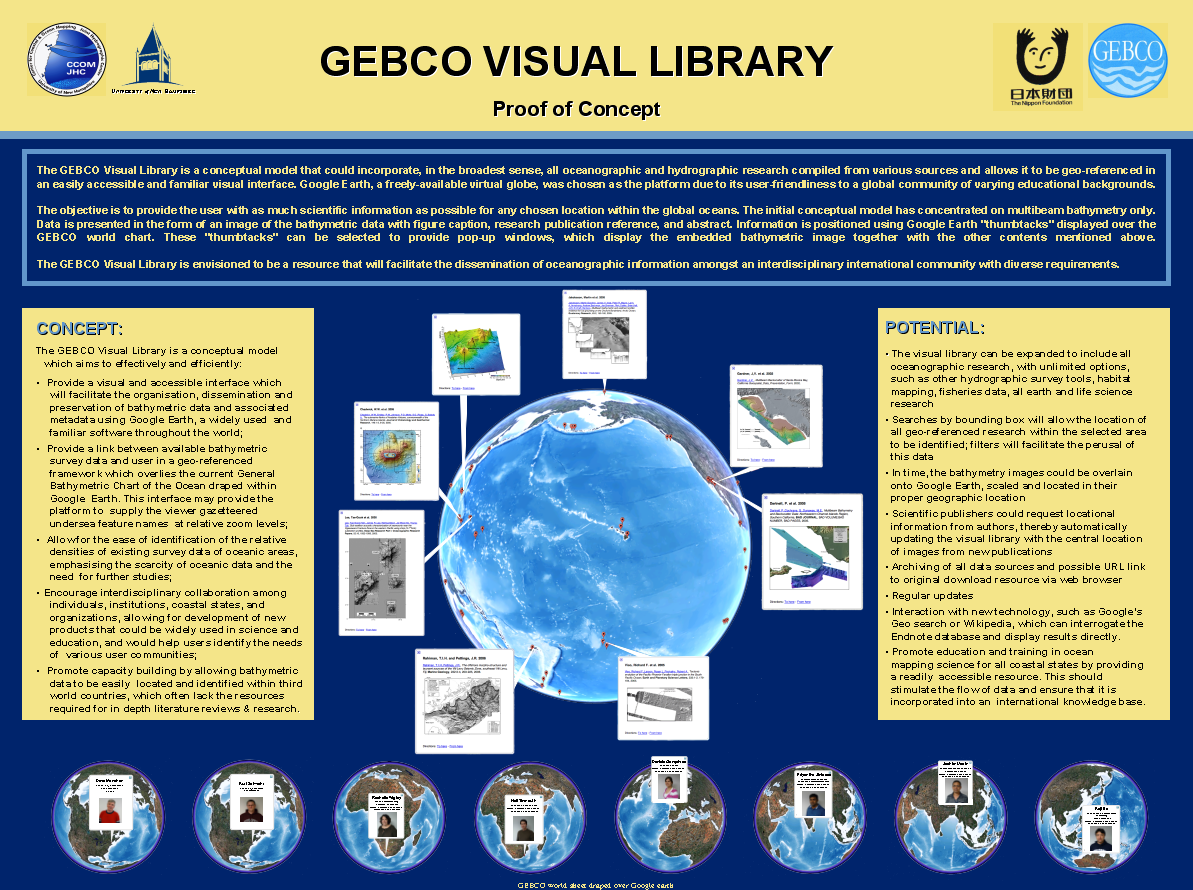
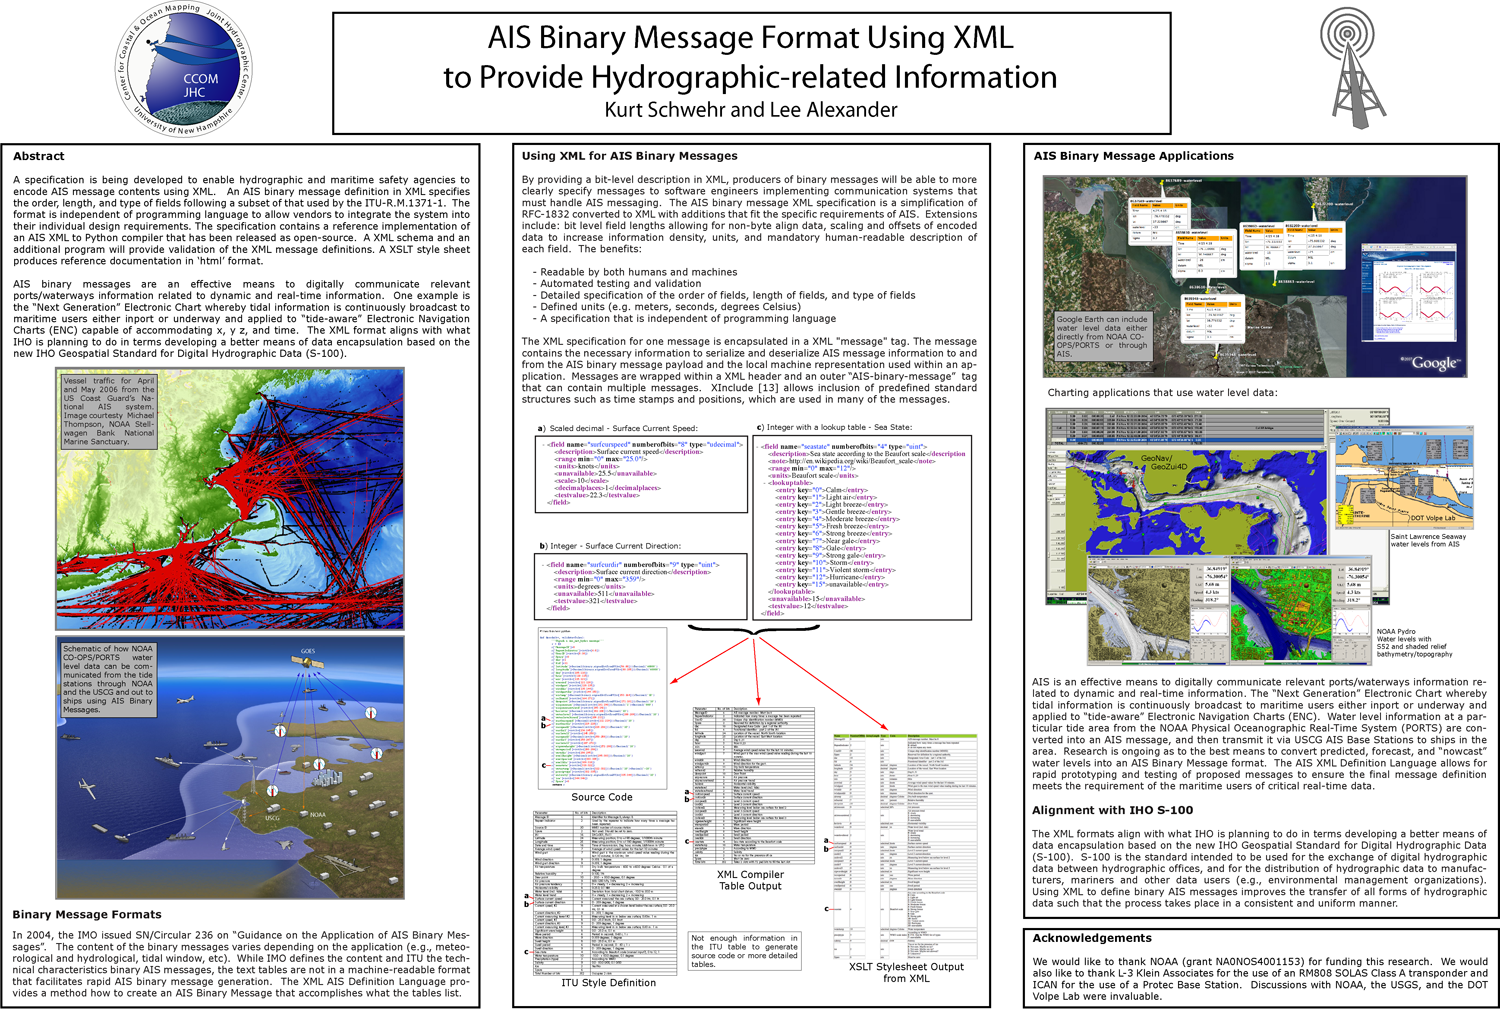
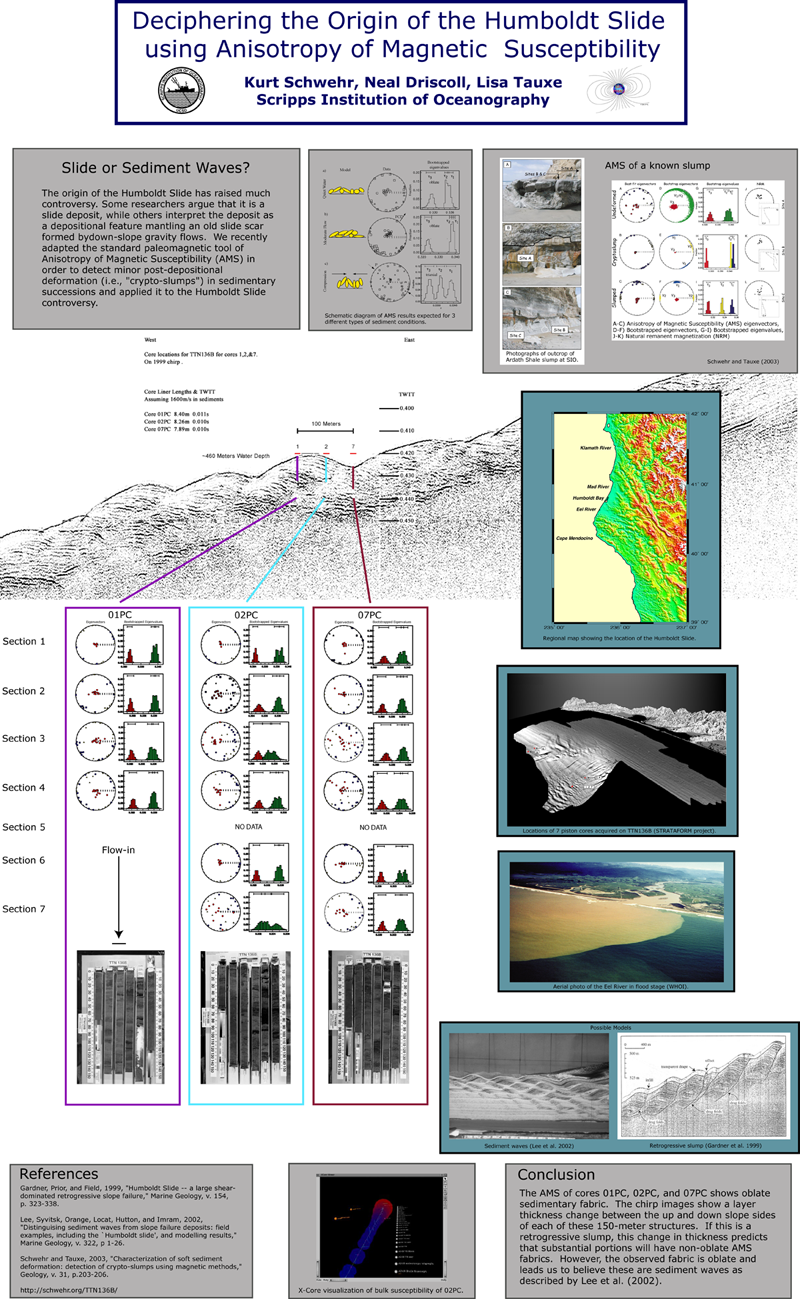
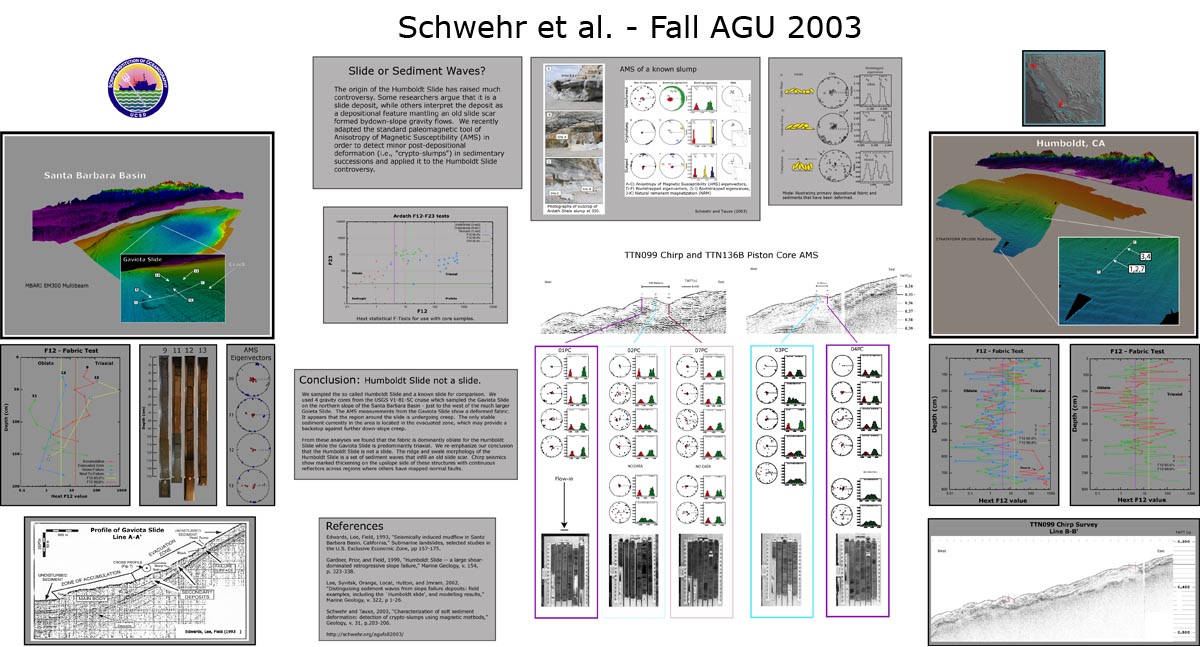
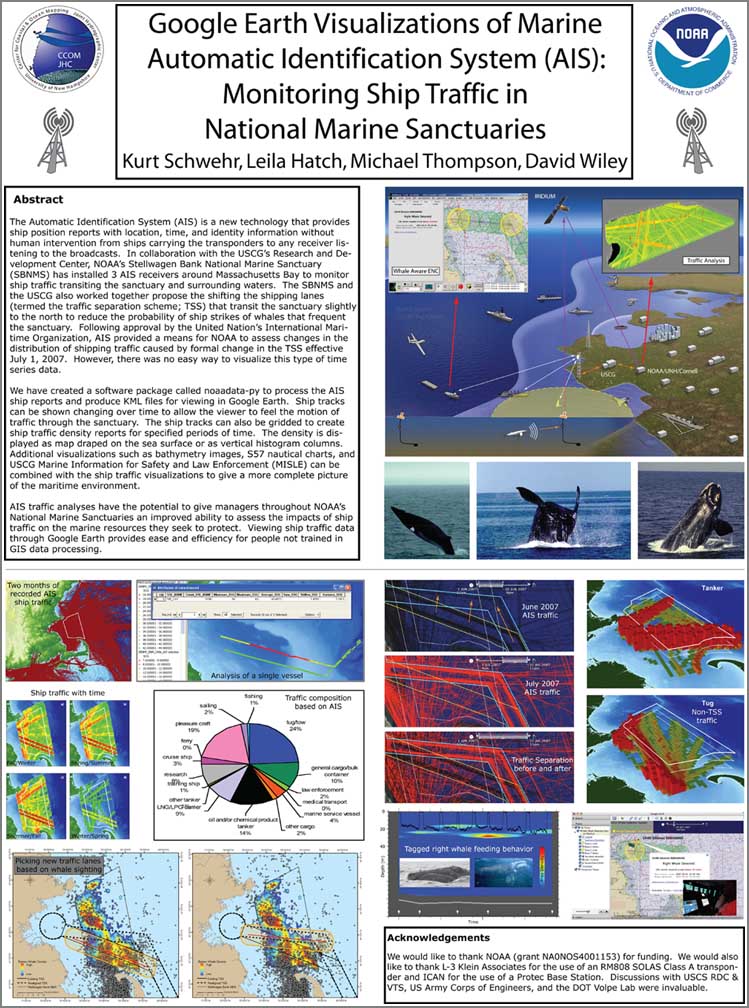